Technology & Engineering
Data Visualization
Data visualization is the graphical representation of data to provide insights and facilitate understanding. It involves creating visual elements such as charts, graphs, and maps to communicate complex information in a clear and concise manner. By transforming data into visual formats, it enables easier interpretation and analysis, aiding in decision-making and problem-solving.
Written by Perlego with AI-assistance
Related key terms
1 of 5
12 Key excerpts on "Data Visualization"
 eBook - ePub
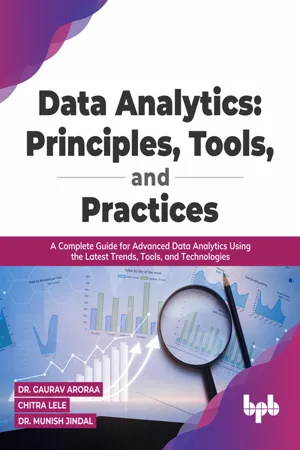
Data Analytics: Principles, Tools, and Practices
A Complete Guide for Advanced Data Analytics Using the Latest Trends, Tools, and Technologies (English Edition)
- Dr. Gaurav Aroraa, Chitra Lele, Dr. Munish Jindal, Dr. Gaurav Aroraa, Chitra Lele, Dr. Munish Jindal(Authors)
- 2022(Publication Date)
- BPB Publications(Publisher)
There are more graphical/visual elements that can be used to represent data. In the coming sections, we will discuss more basic visual elements and see how these elements are helpful to make analyses and strategies.Aims of Data Visualization
The main aims of Data Visualization are to be helpful, scalable, and accurate. It helps users to analyze data for exploration and explanation purposes. It provides accurate data and hence clarity of analysis and insights. Moreover, it is able to scale and adapt to user needs to be based on various factors such as depth, modality, device size, and so on.Without context, the visualization is not that effective. This context is a sort of storytelling that fulfills a business purpose, and it helps the eyes of the users to recognize and their brain to comprehend in an effective and efficient manner and to perceive patterns that may have been missed previously. Skill sets are changing to accommodate a data-driven world, and to support these skills, Data Visualization is critical. Once the data is collected and processed, it can be further simplified and analyzed through Data Visualization aids such as maps, dashboards, tables, graphs, and so on.Techopedia (it is your go-to tech source for professional IT insight and inspiration) defines Data Visualization as: “the process of displaying data/information in graphical charts, figures, and bars .” The definition by Wikipedia (it is a free online encyclopedia, created and edited by volunteers around the world and hosted by the Wikimedia Foundation) states that Data Visualization “is the graphic representation of data. It involves producing images that communicate relationships among the represented data to viewers of the images eBook - PDF
- Gavriel Salvendy, Waldemar Karwowski, Gavriel Salvendy, Waldemar Karwowski(Authors)
- 2021(Publication Date)
- Wiley(Publisher)
Data is any information, qualitative, and/or quantitative that has been collected about one or more persons or objects. Visualization is the process of understanding something by creating its mental picture. Hence Data Visualization is understanding of the data by creating its mental picture. The human brain is better at under-standing visual information compared to numbers or words. Hence, Data Visualization is the process of creating a visual representation of the data to accelerate its understanding. In fact, the process of creating the visual form has become synonymous with Data Visualization and is the main topic of discussion of this chapter. Because of the progress of technology, data is being produced at an ever-increasing rate. It is no longer possible to analyze raw data by scanning through it and understand it. So, more than ever, now the emphasis is on creating the most effec-tive visualization representation to quickly understand the data. Creating the optimal visual representation of data is both an art and a science. In this chapter we will discuss the art behind the creation by outlining the rules and best practices, and where possible we will try to provide the scientific reasoning behind them from the current understanding of human visual system. Visual communication is the oldest form of communication in the history of mankind. Actual graphical communication can be traced back to as early as the second century bc (Friendly, 2006). to the ancient Egyptians who used their maps of the earthly and heavenly positions for navigation. Graphical plots of data can be traced back to an anonymous tenth-century graph, representing time-series plot of position of the celestial bodies, and to the fourteenth-century philosopher Nicole Oresme for the plot of a mathematical function (velocity of a constantly accelerating body) in the form of a bar graph (Der & Everitt, 2015; Schmitt, 1969).
- Mashrur Chowdhury, Amy Apon, Kakan Dey(Authors)
- 2017(Publication Date)
- Elsevier(Publisher)
The first purpose is to use Data Visualization to discover or form new ideas. The second purpose is to visually communicate these ideas through Data Visualization [5]. By providing a comprehensive view of the data structure, Data Visualizations aid in the analysis process and improve the results we can expect from numerical analysis alone [6]. Despite the potential to transform analysis, designing effective Data Visualizations is often difficult. Successful results require a solid understanding of the process for transforming data into visual representations [4], human visual perception [1, 7], cognitive problem solving [1, 8], and graphical design [9]. As a subfield of the computer graphics, Data Visualization techniques use computer graphics methods to display data via visual representations on a display device. Whereas computer graphics techniques focus on geometric objects and graphical primitives (e.g., points, lines, and triangles), Data Visualization techniques extend the process based on underlying data sets. Therefore, we can classify Data Visualization as an application of computer graphics that encompasses several other disciplines, such as human–computer interaction, perceptual psychology, databases, statistics, graphical design, and data mining. It is also significant to note that Data Visualization is differentiated from computer graphics in that it usually does not focus on visual realism, but targets the effective communication of information [4]. In essence, a Data Visualization encodes information into a visual representation using graphical symbols, or glyphs (e.g., lines, points, rectangles, and other graphical shapes). Then, human users visually decode the information by exercising their visual perception capabilities. This visual perception process is the most vital link between the human and the underlying data No longer available |Learn more
Supply Chain Analytics and Modelling
Quantitative Tools and Applications
- Nicoleta Tipi(Author)
- 2021(Publication Date)
- Kogan Page(Publisher)
Visualization is a very powerful tool that aims to bring further clarity to the data available and to the analysis carried out on the data, and it can provide a new interpretation of what is in front of us. In other words, visualization tools help us to make invisible aspects within the data more visible. With the use of technology in everyday life and media, we have become used to looking at data through visual interfaces, and this has become an expectation. We expect to observe information changing over time, using a line graph, or see aggregated information on, for example, annual cost per product through a bar chart, and so on. Visual tools and graphs are embedded in a number of publications we see every day, in media communication and various other displays of data and they are also incorporated in a number of educational programmes from an early stage. Therefore, we are becoming more and more familiar with the use of these tools and our expectation that data will be provided in a well-structured format is becoming the norm.Visualization puts facts into perspective and allows us to take different views on how to start an analysis and/or what to analyse next. Visualization allows us to see continuity in data, missing values, or peaks and valleys in data that we may not have been able to observe otherwise.There are a number of reasons why we seek more and more visual tools and platforms to represent data, information and processes:- A large amount of data and information is available to us in many different forms and formats, from data in numerical format, where the classical graphs are used, to information presented in a more structural setting, where particular models are developed and used to support our understanding and enhance the decision-making process.
- The use of visual tools like graph and charts could help identify characteristics in data that are not easy to spot from the raw data. For example, they can highlight errors in input data where values have been missed, or incorrectly entered in the system, or identify a cluster or a linear aspect to the data behaviour.
- The opportunity to share data and analyse data is much easier, and this is also a reason for seeking to work with and employ more visual tools in representing data and information. Many of the software packages we consider and use for collecting and analysing data have easy-to-use functions that allow a non-computer-specialist to use them and transfer evaluations and results into different documents and formats to relate the information. The communication of data is much easier, not only in terms of being able to create a graph in one software package and transfer this easily into another, but also when working with much more aggregated data.
 eBook - PDF
- Sudha Menon, University of Kerala, India(Authors)
- 2019(Publication Date)
- Society Publishing(Publisher)
Information Visualization 127 exhibiting generally immaterial information so that it encourages the process of learning and remembering. It goes past the known but typical structures of the general database to connect with users at various levels of cognitive understanding, quickening the process of data research. The most essential types of advanced Data Visualization are well-known to student and the mentor in a similar way: Charts and diagrams of different sorts are fundamental visualizations, and the utilization of software devices, for example, PowerPoint represents an early and incomplete effort to address its difficulties. However, the present ways to deal with Data Visualization, supported by modern digital innovation, can change the way visualization is done. They bring another measurement and more noteworthy depth to “flat” educational images. Done accurately, Data Visualization has various advantages for data experts and the general consumer of information resources. Proper visualization systems give a more natural approach to the people to comprehend the various relations between instructive resources that may, at first, give off an impression of being disconnected. In a wide range of fields, visualization gives an approach to cross-examine settings and casual variables that are tedious to find separately. For the general analyst or a person visiting the library, Data Visualization quickens the quest for the “right” resource. This diminishes the cognitive and strategic overhead in a significant manner that is connected with research, encouraging a more productive procedure – and, as it may be believed, more nuanced and in-depth analysis, as an immediate outcome. There is a need for lesser acquaintance with library and data systems, as the researchers themselves tend to share their cognitive burden with the visualization tools.
- Horst Bunke, Lam Peng, Terry Michael Caelli(Authors)
- 1997(Publication Date)
- World Scientific(Publisher)
But the actual working environ-ment of application specialists really needs to reflect not just one end result or task associated with producing the result, but the full expected range of end results and associated sets of tasks. Multiple paradigms Advances in networking have introduced the additional problem that many data sets are now being accessed by specialists from different disciplines. Data structuring and derived data or metadata, must increasingly be accessible to a range of fields with different expectations and practices. There may also be requirements for different views of the data for different tasks within a discipline. This increasingly calls for intelligent conversion layers for any given field with specific requirements. 3. THE EVOLUTION OF INTERACTIVE VISUALIZATION SYSTEMS Interactive visualization is central to enabling the expertise of application practi-tioners. Why visualization? Because visualization is the process of using a picture of data to help build a better understanding — to mentally visualize the data. It helps give insights into data, problems and processes by exploiting the eye's 266 P. K. ROBERTSON direct access to the brain. It takes advantage of the brain's powerful capacity to see patterns and trends, and to detect anomalies, in large amounts of complex data. And why interactive? Because interaction allows a user to reach in and adjust the picture. Interaction exploits hand-eye coordination and short-term memory capabil-ities by drawing a user into exploring the data and problems. Parameters of models and views of the data can be adjusted with immediate feedback on the result. This is how we explore real-world objects: we pick them up, turn them around, take them apart, and put them back together. Visualization is thus more than a display; it implies the building of a mental model linking the display with its context.
- William T. Loging(Author)
- 2016(Publication Date)
- Cambridge University Press(Publisher)
Computers and their affiliated apparatus can do power- ful things graphically, in part by turning out the hundreds of plots necessary for good data analysis. But at least a few computer graphics only evoke the response “Isn’t it remarkable that the computer can be programmed to draw like that?” instead of “My, what interest- ing data.” (Tufte, 2007) There is, fortunately, an abundance of references in the areas of information visu- alization; in particular, Envisioning Information (Tufte, 1990) remains a classic both in the narrative but also on the fundamentals of displaying information. So what can computers do for us in the areas of Data Visualization? The add- itional power of Data Visualization can be seen first by taking an example from Semiology of Graphics (Bertin, 2010). This example illustrates data clearly; how- ever, when using a dot density version, it immediately draws the attention of the reader to the higher density areas. This would prompt the viewer to further investi- gate certain regions over others. Perhaps the first attempt at recreating this in modern times using a computer would be the use of color, higher-definition graphics and precision. However, this Information visualization – important IT considerations 147 adds little value to the overall chart, and would most likely induce confusion as to the meaning of the different colors where the eye is continuously shifting between legend and chart. More interesting approaches to the use of computers would be the ability to dis- play a view at a global scale or zooming into a particular region and breaking it down into smaller regions – geographic travel. Or perhaps, travel through time as the Trendalyzer software system, initially developed by the Gapminder Foundation (http://graphs.gapminder.org), demonstrates in a multivariable relationship bubble chart with the option to “travel” back and forth in time. eBook - PDF
Information Design for the Common Good
Human-centric Approaches to Contemporary Design Challenges
- Courtney Marchese(Author)
- 2021(Publication Date)
- Bloomsbury Visual Arts(Publisher)
With seemingly endless information at our fingertips, there is more need than ever to be able to process and make sense of the world’s data quickly and efficiently. Information design has become an essential and in-demand area to which graphic designers can contribute. Whether referred to as information design, information graphics, infographics, Data Visualization or other similar terms, they all refer to a visual representation of information or data. For our purposes, information design refers to the visual display of non-numerical information, such as a lifecycle diagram or flowchart. Data Visualization, as described by Michael Friendly (2007), “is the science of visual representation of ‘data’ defined as information which has been abstracted in some schematic form, including attributes or variables for the units of information.” A few common examples include statistical graphs for financial data and thematic cartography like weather maps. It has become critical today to engage in the process that puts abstract data into forms we can see and understand quickly. For designers, this means an increased need for embracing both quantitative and qualitative research through strategic thinking, systemic thinking 14 The roots of data-driven design just not necessarily concerning a quantitative context. While designers are skilled in understanding audiences and using aesthetics to speak to those audiences, they also “must be professionally, culturally and socially responsible for the impact their design has on the citizenry”. (Resnick 2016). Thus, it would be irresponsible for designers to assume without proper training that they are statisticians, and likewise irresponsible for statisticians to assume that they have the artistic skills necessary to engage an audience with their data. Instead, information design and Data Visualization often necessitate an interdisciplinary team to most confidently collect, analyze and display information of value. eBook - PDF
- Jeffrey Camm, James Cochran, Michael Fry, Jeffrey Ohlmann(Authors)
- 2018(Publication Date)
- Cengage Learning EMEA(Publisher)
We also discussed several advanced data-visualization charts, such as parallel-coordinates plots, treemaps, and GIS charts. We introduced data dashboards as a data-visualization tool that provides a summary of a firm’s operations in visual form to allow managers to quickly assess the cur- rent operating conditions and to aid decision making. Many other types of charts can be used for specific forms of Data Visualization, but we have covered many of the most-popular and most-useful ones. Data Visualization is very important for helping someone analyze data and identify important relations and patterns. The effective design of tables and charts is also necessary to communicate data analysis to others. Tables and charts should be only as complicated as necessary to help the user understand the patterns and relationships in the data. G L O S S A R Y Bar chart A graphical presentation that uses horizontal bars to display the magnitude of quantitative data. Each bar typically represents a class of a categorical variable. Bubble chart A graphical presentation used to visualize three variables in a two-dimen- sional graph. The two axes represent two variables, and the magnitude of the third variable is given by the size of the bubble. Chart A visual method for displaying data; also called a graph or a figure. Clustered-column (or clustered-bar) chart A special type of column (bar) chart in which multiple bars are clustered in the same class to compare multiple variables; also known as a side-by-side-column (bar) chart. Column chart A graphical presentation that uses vertical bars to display the magnitude of quantitative data. Each bar typically represents a class of a categorical variable. Crosstabulation A tabular summary of data for two variables. The classes of one variable are represented by the rows; the classes for the other variable are represented by the columns. Data dashboard A data-visualization tool that updates in real time and gives multiple outputs.
- Kevin D. Finson, Jon Pedersen, Kevin D. Finson, Jon E. Pedersen(Authors)
- 2013(Publication Date)
- Information Age Publishing(Publisher)
Visual Data and Their Use in Science Education, pages 309–332 Copyright © 2013 by Information Age Publishing All rights of reproduction in any form reserved. 309 CHAPTER 13 EXPLORING THE USE OF VISUAL DATA TO UNCOVER SCIENCE STUDENTS’ CONCEPTIONS OF AN ENGINEER AND ENGINEERING Brenda M. Capobianco Purdue University Stephen L. Thompson University of South Carolina INTRODUCTION Science and engineering are human intellectual endeavors, with their own respective communities of practitioners, unique bodies of estab- lished knowledge and practices, and cross-cutting ideas and approaches (National Research Council [NRC], 2011). Although science and engi- neering work are often portrayed as being similar in nature and there is much overlap across the two disciplines, one may say there is just as much 310 B. M. CAPOBIANCO and S. L. THOMPSON difference that exists across science and engineering. In particular, engi- neering generally yields outcomes that include products and processes rather than theories and scientific knowledge (National Academy of Engi- neering [NAE] and NRC, 2009). The nature of work within the disciplines also varies. Engineers solve specific problems using the design process, while scientists inquire into natural systems (NAE and NRC, 2009). Adopt- ing and accurately representing these ideas and principles for science and engineering have become important components of a national effort to move science education toward a more coherent, globally responsive vi- sion. The National Research Council (2011) recently presented the na- tion’s Conceptual Framework for New K12 Science Standards. Embedded is this reform document is the integrated role science and engineering plays in providing students with fundamental knowledge and skills necessary to participate freely and productively in solving humanity’s most pressing and future challenges (NRC, 2011). eBook - PDF
- Tiziana Catarci, Alan Dix, Stephen Kimani, Giuseppe Santucci(Authors)
- 2022(Publication Date)
- Springer(Publisher)
19 C H A P T E R 3 Beyond Querying So far, we have concentrated mainly on user-oriented mechanisms to extract the information of interest from data sources. In this section, we see how visual mechanisms can be exploited to analyze and make sense out of the data. 3.1 INFORMATION VISUALIZATION The fact that suitable visualizations could convey information in a quick and efficient way has been understood for a long time, and drawings and visualizations have been extensively used in different data analysis or information exchange contexts, e.g., teaching, designing, information spreading, data exploring, etc. Among several, noticeable examples can be found the famous Dr. John Snow intuition of plotting deaths of cholera on a 1845 map of the Soho district of London and the pioneering approach of Harry Beck that proposed on 1931 a distorted map of the London underground. The Snow’s drawing (see Figure 3.1) allowed for visually identifying a concentration of deaths around the Broad Street water pump; closing that source of contaminated water resulted in a decrease in the number of deaths from cholera ( Tufte, E. , 1997). The Beck’s map, presenting the sequence of stations and their interchanges in a schematic and clearer way (disregarding a strict correlation with the real topography of the underground), is now influencing the maps of most transport systems throughout the world (see Figure 3.2). Even if, in principle, as the two above examples testify, visualization has nothing to do with computers and paper based drawings could be very effective (and they still are), the modern inter- pretation of Information Visualization gives a central role to computational means, allowing quick data manipulation and highly interactive visualizations. The basic visualization flow is depicted in Figure 3.3. eBook - PDF
- Roberto Tamassia(Author)
- 2013(Publication Date)
- Chapman and Hall/CRC(Publisher)
22 Graph Drawing for Data Analytics Stephen G. Eick VisTracks and U. Illinois at Chicago 22.1 Introduction ................................................. 681 22.2 Where Network Visualization Creates High Value .... 682 User Interface • Visual Presentation and Branding • Executive Dashboards • Real-Time Visual Reports • Visual Discovery for Deep Analysis • Searching and Exploration • Domain Task-Specific Visualizations 22.3 Network Visualization Sweet Spot ....................... 688 22.4 Customers for Network Visualization Software ........ 691 22.5 Business Models for Network Visualization ............. 691 Custom Software • Enterprise Software • Shrink-Wrapped Software • Open Source Software • Cloud Computing • Network Visualization Deployments 22.6 Thin-client Network Visualization ....................... 693 22.7 Discussion and Summary .................................. 695 References .......................................................... 696 22.1 Introduction Over the last decade graph drawing and network visualization has emerged as an exciting research area that is addressing a significant problem: how to make sense of the ever increasing amounts of relational information that has become widely available. With the growth of networking and decreasing cost of storage it has become technically feasible and cost effective to store and access vast sets of information. The academic, business, and government challenge is how to make sense of this information and translate the insights into value-producing activities. As a new emerging field, there will certainly be opportunities for network visualization and graph drawing technology. There have already been some early successes and also many prototypes that have been research successes but have not led to successful deploy-ments. Unfortunately, not all network visualizations create enough value so that users will switch over from conventional user interfaces to adopt new visual interfaces.
Index pages curate the most relevant extracts from our library of academic textbooks. They’ve been created using an in-house natural language model (NLM), each adding context and meaning to key research topics.