
eBook - ePub
Geographical Information and Climatology
Pierre Carrega, Pierre Carrega
This is a test
Condividi libro
- English
- ePUB (disponibile sull'app)
- Disponibile su iOS e Android
eBook - ePub
Geographical Information and Climatology
Pierre Carrega, Pierre Carrega
Dettagli del libro
Anteprima del libro
Indice dei contenuti
Citazioni
Informazioni sul libro
This book includes two parts. The first part is more theoretical and general, and it covers fundamental principles: geospatial climate data measurement; spatial analysis, mapping and climate; geographical information, remote sensing and climatology; and geographical information for initialisation of forecasting and climate models.
The second part describes geographical information used in various climate applications of importance today, related to risk: urban climate; air pollution; hydrological problems linked to climatology; forest fires.
Domande frequenti
Come faccio ad annullare l'abbonamento?
È semplicissimo: basta accedere alla sezione Account nelle Impostazioni e cliccare su "Annulla abbonamento". Dopo la cancellazione, l'abbonamento rimarrà attivo per il periodo rimanente già pagato. Per maggiori informazioni, clicca qui
È possibile scaricare libri? Se sì, come?
Al momento è possibile scaricare tramite l'app tutti i nostri libri ePub mobile-friendly. Anche la maggior parte dei nostri PDF è scaricabile e stiamo lavorando per rendere disponibile quanto prima il download di tutti gli altri file. Per maggiori informazioni, clicca qui
Che differenza c'è tra i piani?
Entrambi i piani ti danno accesso illimitato alla libreria e a tutte le funzionalità di Perlego. Le uniche differenze sono il prezzo e il periodo di abbonamento: con il piano annuale risparmierai circa il 30% rispetto a 12 rate con quello mensile.
Cos'è Perlego?
Perlego è un servizio di abbonamento a testi accademici, che ti permette di accedere a un'intera libreria online a un prezzo inferiore rispetto a quello che pagheresti per acquistare un singolo libro al mese. Con oltre 1 milione di testi suddivisi in più di 1.000 categorie, troverai sicuramente ciò che fa per te! Per maggiori informazioni, clicca qui.
Perlego supporta la sintesi vocale?
Cerca l'icona Sintesi vocale nel prossimo libro che leggerai per verificare se è possibile riprodurre l'audio. Questo strumento permette di leggere il testo a voce alta, evidenziandolo man mano che la lettura procede. Puoi aumentare o diminuire la velocità della sintesi vocale, oppure sospendere la riproduzione. Per maggiori informazioni, clicca qui.
Geographical Information and Climatology è disponibile online in formato PDF/ePub?
Sì, puoi accedere a Geographical Information and Climatology di Pierre Carrega, Pierre Carrega in formato PDF e/o ePub, così come ad altri libri molto apprezzati nelle sezioni relative a Ciencias físicas e Meteorología y climatología. Scopri oltre 1 milione di libri disponibili nel nostro catalogo.
Informazioni
Chapter 1
Basics of Climatological and Meteorological Observations for GIS Applications 1
Weather and climate data are spatially distributed. Geographical information technologies can therefore provide a useful and relevant working environment for the distribution, integration, visualization, and analysis of these data. However, compared to other scientific areas, the application of geographical information system (GIS) tools was for a long time a clumsy process within meteorology and climatology, and especially within most national meteorological services (NMS); because of the shortcomings of GIS related to the underlying data model and missing interfaces to standard meteorological tools (e.g. weather forecast model). While the GIS data models are highly static based, meteorological data models have a need for a strong dynamical component with causal dependencies in the space/time domain (see for example [CHR 02]). Nativi et al. [NAT 04] describe the differences between both underlying data models and advocate models that are supported by so-called interoperability services. In addition to these differences in the data models, there are significant differences in the spatial modeling approaches. In general, GIS environments have implemented the geo-statistical modeling tools that are based on one temporal realization only, whereas meteorological data offer the temporal sample in addition to the spatial sample, which results in different spatial modeling approaches [SZE 04]. However, within the last few years efforts for integration of meteorological data models in GI environments were quite successful, and well-established GIS web-mapping standards and spatial infrastructures have gained increasing importance in meteorology and climatology. Thus parallel efforts and development currently appear to be resolved [SHI 05].
Information to be derived from climate variability analyses is strongly dependent not only on the spatiotemporal density, but also on the quality of the available data. Today it is a well-established fact in climatology that the climate signal from measurements, beside the statistical noise, is by inhomogenities. Therefore, a primary step of climate studies is to analyze the input data used with respect to quality and homogenity, which makes the results uncertain regarding input data, in addition to the uncertainty of the approach. Quantifying quality and homogenity of the data require data about the data itself (the metadata). Nowadays, metadata are highly standardized for GI data (e.g. see the Open GIS Consortium activities), but the information obtained from metadata regarding climate data is still heterogenous. However, the NMSs and the WMO (World Meteorological Organization) are aware of the importance of climate metadata, which resulted in several efforts for standardization of metadata (see e.g. [AGU 03]). To summarize these efforts, it can be stated that in climatology metadata information is related to the documentation of the “where”, “when”, and “how” of measurements, whereas metadata in GI science also add emphasis to the usability of the data.
In this chapter, basic concepts of climate networks and climate data are presented. This includes an overview of standards of climate measurements, description of climate data types, spatial reference of data, as well general comments on accessing the data. The areas of climate data quality and homogenity are reviewed in depth, covering the important aspects of metadata description. The chapter does not tackle climate model data and only introduces climate reanalysis data.
1.1. Data measurements and observations in climatology
1.1.1. Networks and concepts for meteorological/climate data
Meteorological measurements are motivated by the primary aim of predicting the Earth’s weather with the highest possible precision. This aim results in measurements covering the entire Earth (for both the land and the sea), but also encompassing the third dimension (vertical sounding of the atmosphere by radio sounds, satellite sensors, radar, etc). Beside weather forecasting, meteorological services are responsible for monitoring the state and spatiotemporal change of the climate. As these two basic aims do not coincide with respect to network performance, two different networks have been established in public weather services, the synoptic and the climate network. Whereas, the stations and instruments are identical, the networks differ in their interval, quantity, availability and time of observations. Moreover, the synoptic network is characterized by the need for a much larger spatial extent and more detailed information on past and current weather situations. In contrast, climate networks are characterized by higher demands on data quality. All national meteorological/climatological networks are coordinated on an international level by the WMO.
The need for meteorological/climatological networks is met by in situ measurements and by remote sensing techniques. Consequently, the WMO Global Observing System is composed of the surface-based subsystem and the space-based subsystem. The surface-based subsystem includes different types of station networks (e.g. surface synoptic stations, climatological stations), whereas the space-based subsystem comprises, for example, on-board sounding from spacecraft. The observational requirements of a climatological station or synoptical station are detailed in [WMO 03] and include: present weather, past weather, wind direction and speed, cloud amount, cloud type, cloud-base height, visibility, air temperature, relative humidity, air pressure, precipitation, snow cover, sunshine duration or solar radiation, soil temperature, evaporation.
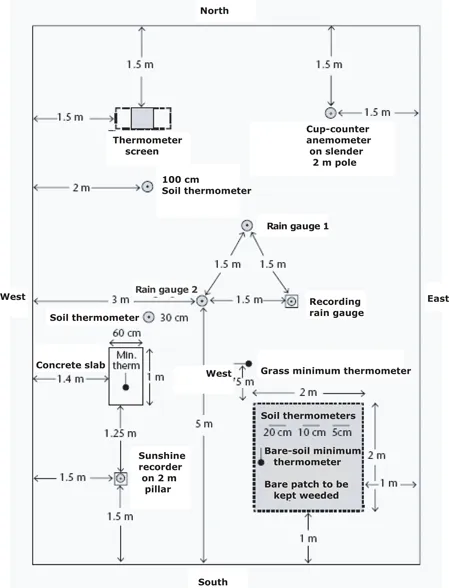
Figure 1.1. Layout of an observing station in the northern hemisphere showing minimum distances between installations (from [WMO 08])
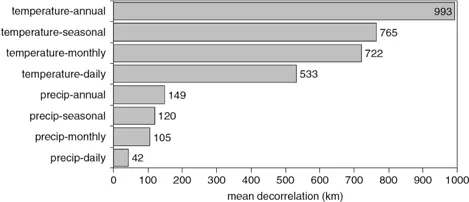
An important concept behind climate observations is representativeness, which is the degree to which the observation accurately describes the value of the variable needed for a specific purpose. Therefore, it is not a fixed quality of any observation, but results from joint appraisal of instrumentation, measurement interval and exposure against the requirements of some particular application [WMO 08]. An estimate of spatiotemporal representativeness of air temperature and precipitation is shown in Figure 1.2, with much higher spatial correlation for air temperature compared with precipitation. It can be concluded from this results that station density has to be much higher for precipitation compared with air temperature and that station density has to be increased for investigations with increasing temporal resolution.
Figure 1.2. Average decorrelation distances (r² decreasing below 0.5) for air temperature and precipitation in four time resolutions. Samples: daily values for all of Europe; monthly, seasonal and annual for the Greater Alpine Region (from [AUE 05])
Various meteorological applications have their own preferred timescale and space scale for averaging, station density, and resolution of phenomena. From there, for example, weather forecast requires more frequent observations compared to climate monitoring. The spatio-temporal dependency of meteorological phenomena results in simple scaling convention (see Table 1.1).
Table 1.1. Spatial and temporal scales of meteorological phenomena
| Type of motion | Spatial scale (m) | emporal scale |
| Eddy | 0.001 | 0.001 |
| Micro turbulence | 10 | 10 |
| Tornado | 100 | 60 |
| Cumulus convection | 1,000 | 20 min |
| Cumulunimbus | 100,000 | 1 h |
| Front | 100,000 | 3 h |
| Hurrican | 100,000 | 3 h |
| Cyclone | 1,000,000 | 1 d |
| Planetaric waves | 10,000,000 | 10 d |
The design of a meteorological station has to be according to the network requirements. In particular, the station site, instrument exposure and location of sensors has to be treated according to regulations. As an example, Figure 1.1 shows the layout for a typical synoptic/climatological station according to WMO regulations.
1.1.2. Standards for climate data measurements
The term “standard” is related to the various instruments, methods, and scales used to estimate the uncertainty of measurements. Amongst others, nomenclature for standards of measurements is given in the International Vocabulary of Basic and General Terms in Metrology issued by the International Organization for Standardization (ISO) [ISO 93]. The following standards are included: measurement standard, international standard, national standard, working standard, transfer standard, traceability, etc.
Meteorological observations and measurements are highly standardized from WMO or from NMSs. Such standardization is obvious if we takes into account the influence of station surroundings (surface properties, influences from nearby buildings, trees, etc) or of measurement observation procedures. From there meteorological (climatological) measurements are standardized especially with respect to:
– surface conditions in the nearby of the sensor;
– station surrounding;
– sensor-height above ground;
– procedure of reading;
– observation time.
However, practices are different and measurements are occasionally performed under conditions that are different from the required standard, which have to be archived in metadata information. This is especially true for the surface conditions in the areas around the sensor and the station, whereas sensor height and observation are generally in accordance with the standards. Standards are more accurately considered in climate networks of weather services compared with networks from other operators. When incorporating data from various other sources, the standardization regulations of the data providers should be carefully considered.
1.1.3. Climate data types
Classification of data types can be undertaken from different perspectives. Using classical classification schemes used in GI science the following types of data are used in meteorology and climatology.
– Spatial irregularly distributed point data: e.g. the station measurements and observations, vertical radio sounding data if some generaliza...