Effect Sizes, Confidence Intervals, and Meta-Analysis
Geoff Cumming
This is a test
This is a test
536 pagine
English
ePUB (disponibile sull'app)
Disponibile su iOS e Android
eBook - ePub
Understanding The New Statistics
Effect Sizes, Confidence Intervals, and Meta-Analysis
Geoff Cumming
Dettagli del libro
Anteprima del libro
Indice dei contenuti
Citazioni
Informazioni sul libro
This is the first book to introduce the new statistics - effect sizes, confidence intervals, and meta-analysis - in an accessible way. It is chock full of practical examples and tips on how to analyze and report research results using these techniques. The book is invaluable to readers interested in meeting the new APA Publication Manual guidelines by adopting the new statistics - which are more informative than null hypothesis significance testing, and becoming widely used in many disciplines.
Accompanying the book is the Exploratory Software for Confidence Intervals (ESCI) package, free software that runs under Excel and is accessible at www.thenewstatistics.com. The book's exercises use ESCI's simulations, which are highly visual and interactive, to engage users and encourage exploration. Working with the simulations strengthens understanding of key statistical ideas. There are also many examples, and detailed guidance to show readers how to analyze their own data using the new statistics, and practical strategies for interpreting the results. A particular strength of the book is its explanation of meta-analysis, using simple diagrams and examples. Understanding meta-analysis is increasingly important, even at undergraduate levels, because medicine, psychology and many other disciplines now use meta-analysis to assemble the evidence needed for evidence-based practice.
The book's pedagogical program, built on cognitive science principles, reinforces learning:
Boxes provide "evidence-based" advice on the most effective statistical techniques.
Numerous examples reinforce learning, and show that many disciplines are using the new statistics.
Graphs are tied in with ESCI to make important concepts vividly clear and memorable.
Opening overviews and end of chapter take-home messages summarize key points.
Exercises encourage exploration, deep understanding, and practical applications.
This highly accessible book is intended as the core text for any course that emphasizes the new statistics, or as a supplementary text for graduate and/or advanced undergraduate courses in statistics and research methods in departments of psychology, education, human development, nursing, and natural, social, and life sciences. Researchers and practitioners interested in understanding the new statistics, and future published research, will also appreciate this book. A basic familiarity with introductory statistics is assumed.
Domande frequenti
Come faccio ad annullare l'abbonamento?
È semplicissimo: basta accedere alla sezione Account nelle Impostazioni e cliccare su "Annulla abbonamento". Dopo la cancellazione, l'abbonamento rimarrà attivo per il periodo rimanente già pagato. Per maggiori informazioni, clicca qui
È possibile scaricare libri? Se sì, come?
Al momento è possibile scaricare tramite l'app tutti i nostri libri ePub mobile-friendly. Anche la maggior parte dei nostri PDF è scaricabile e stiamo lavorando per rendere disponibile quanto prima il download di tutti gli altri file. Per maggiori informazioni, clicca qui
Che differenza c'è tra i piani?
Entrambi i piani ti danno accesso illimitato alla libreria e a tutte le funzionalità di Perlego. Le uniche differenze sono il prezzo e il periodo di abbonamento: con il piano annuale risparmierai circa il 30% rispetto a 12 rate con quello mensile.
Cos'è Perlego?
Perlego è un servizio di abbonamento a testi accademici, che ti permette di accedere a un'intera libreria online a un prezzo inferiore rispetto a quello che pagheresti per acquistare un singolo libro al mese. Con oltre 1 milione di testi suddivisi in più di 1.000 categorie, troverai sicuramente ciò che fa per te! Per maggiori informazioni, clicca qui.
Perlego supporta la sintesi vocale?
Cerca l'icona Sintesi vocale nel prossimo libro che leggerai per verificare se è possibile riprodurre l'audio. Questo strumento permette di leggere il testo a voce alta, evidenziandolo man mano che la lettura procede. Puoi aumentare o diminuire la velocità della sintesi vocale, oppure sospendere la riproduzione. Per maggiori informazioni, clicca qui.
Understanding The New Statistics è disponibile online in formato PDF/ePub?
Sì, puoi accedere a Understanding The New Statistics di Geoff Cumming in formato PDF e/o ePub, così come ad altri libri molto apprezzati nelle sezioni relative a Psicologia e Ricerche e metodologie nella psicologia. Scopri oltre 1 milione di libri disponibili nel nostro catalogo.
This book is about how to picture and think about experimental results. I'll start with a simple pattern of results you may have seen many times, but first I should say what this chapter is about. It introduces
Null hypothesis significance testing (NHST) and confidence intervals (CIs) as two different ways to present research results
Meta-analysis as a way to combine results, and thus a third way to present them
The desirability of shifting emphasis from NHST to CIs and meta-analysis, which are important parts of what I'm calling the new statistics
Three ways of thinking that correspond to the three ways to present results
Evidence-based practice in statistics, statistical cognition, and some relevant evidence
ESCI (pronounced “ESS-key,” Exploratory Software for Confidence Intervals)
A Familiar Situation: Lucky–Noluck
Consider first a simple pattern of results you may be familiar with.
First Presentation: NHST
Suppose you read the following in the introduction to a journal article:
Only two studies have evaluated the therapeutic effectiveness of a new treatment for insomnia. Lucky (2008) used two independent groups each of size N = 22, and Noluck (2008) used two groups each with N = 18. Each study reported the difference between the means for the new treatment and the current treatment.
Lucky (2008) found that the new treatment showed a statistically significant advantage over the current treatment: M (difference) = 3.61, SD (difference) = 6.97, t(42) = 2.43, p = .02. The study by Noluck (2008) found no statistically significant difference between the two treatment means: M(difference) = 2.23, SD(difference) = 7.59, t(34) = 1.25, p = .22.
What would you conclude? Are the two studies giving consistent or inconsistent messages? Is the new treatment effective? What conclusions about the two studies would you expect to read in the next couple of sentences of the article?
Here are three possible answers:
Inconsistent “The Lucky result is clearly statistically significant at the .05 level, whereas the Noluck result is clearly not statistically significant. The two results conflict. We can't say whether the treatment is effective, and we should examine the two studies to try to find out why one found an effect and the other didn't. Further research is required to investigate why the treatment works in some cases, but not others.”
Equivocal “One result is statistically significant, and the other statistically nonsignificant, although the two are in the same direction. We have equivocal findings and can't say whether the treatment is effective. Further research is required.”
Consistent “The two results are in the same direction, and the size of the mean difference is fairly similar in the two studies. The two studies therefore reinforce each other, even though one is statistically significant and the other is not. The two results are consistent and, considered together, provide fairly strong evidence that the treatment is effective.”
Choose which of the three answers is closest to your own opinion. You could also consider what conclusion would be most likely if such results were discussed in whatever discipline you are most familiar with. I invite you to note down your answers before reading on. Take some time; maybe have a coffee.
Second Presentation: Confidence Intervals
Now suppose that, instead, the introduction to the article described the two studies as follows:
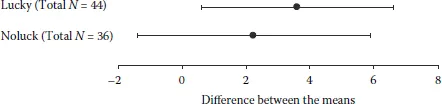
Only two studies have evaluated the therapeutic effectiveness of a new treatment for insomnia. Lucky (2008) used two independent groups each of size N = 22, and Noluck (2008) used two groups each with N = 18. Figure 1.1 reports for each study the difference between the means for the new treatment and the current treatment, with the 95% confidence interval on that difference.
FIGURE 1.1 Difference between the means (mean for new treatment minus mean for current treatment) for treatments for insomnia in the Lucky (2008) and Noluck (2008) studies, with 95% confidence intervals. A positive difference indicates an advantage for the new treatment.
Once again, take a minute to think what you would conclude. Are the two studies giving similar or different messages? Is the new treatment effective? Choose Inconsistent, Equivocal, or Consistent as coming closest to your opinion. Again, note down your answers.
Third Presentation: Meta-Analysis
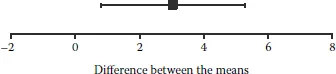
Now, finally, suppose the introduction to the article described the two studies, then in Figure 1.2 reported the result of a meta-analysis of the two sets of results. (Chapters 7, 8, and 9 discuss meta-analysis. Think of it as a systematic way to combine the results from two or more related studies.)
Only two studies have evaluated the therapeutic effectiveness of a new treatment for insomnia. Lucky (2008) used two independent groups each of size N = 22, and Noluck (2008) used two groups each with N = 18. Each study reported the difference between the means for the new treatment and the current treatment.
Once again, think how you would interpret this result. Is the new treatment effective? How strong is the evidence? Again, note down your answers.
FIGURE 1.2 Difference between the means (mean for new treatment minus mean for current treatment) for treatments for insomnia, with its 95% confidence interval, from a meta-analysis of two studies that compared a new treatment with the current treatment. Total N = 80. A positive difference indicates an advantage for the new treatment. The null hypothesis of no difference was rejected, p = .008.
Some Terminology
I need to introduce some terminology, which may or may not be familiar to you. Statistical inference is the drawing of conclusions about the world (more specifically: about some population) from our sample data. In the Lucky–Noluck example we can assume that the population of interest is the notional set of all possible differences in scores between the current and new treatments, for all people affected by insomnia. A researcher should define the population carefully (Which people? What definition of insomnia?), although often the reader is left to assume. We wish to make a statistical inference about the population parameter of interest, which here is the mean difference in scores.
Statistical inference draws conclusions about a population, based on sample data.
You are probably familiar with null hypothesis significance testing (NHST), which is the most common way to carry out statistical inference in a range of disciplines, including many social and behavioral science disciplines, and some biosciences. I'll refer to disciplines that rely at least to a moderate extent on NHST as NHST disciplines. To use NHST you typically specify a null hypothesis then calculate a p value, which you use to decide whether to reject or not reject the null hypothesis at some significance level, most commonly .05 or .01. The first presentation of the Lucky–Noluck results used an NHST format, and the conclusion whether or not to reject the hypothesis that the population mean difference is zero hinged on whether or not p was less than .05. In other words, a result was declared statistically significant or not, depending on whether p < .05 or not.
Null hypothesis significance testing (NHST) tests a null hypothesis—usually that there is no difference—and uses the p value to either reject or not reject that hypothesis.
A second approach to statistical inference is estimation, which focuses on finding the best point estimate of the population parameter that's of greatest interest; it also gives an interval estimate of that parameter, to signal how close our point estimate is likely to be to the population value. The second presentation of the Lucky–Noluck results used an estimation format. Figure 1.1 gives point estimates, which are the sample mean differences marked with the round dots. These are our best estimates, one from each study, of the true mean advantage of the new treatment. The 95% CIs are the interval estimates, and the fact that they are so long signals that our point estimates give only imprecise information about the population values, although any interpretation of CI length requires understanding of the scale we're using.
Estimation is a second approach to statistical inference. It uses sample data to calculate point estimates and interval estimates of population parameters.
The third presentation, in Figure 1.2, combines the Lucky and Noluck results. I calculated it using meta-analysis, which is a collection of techniques for the quantitative analysis of the results from two or more studies. At its simplest, it gives a point estimate that is a weighted average of the separate study means. (The weights depend on the sample sizes and variances of the separate studies.) It also gives an overall interval estimate that signals how precise an estimate the weighted average is likely to be.
Meta-analysis is a set of techniques for the quantitative analysis of results from two or more studies on the same or similar issues.
The Best Interpretation of Lucky–Noluck
All three presentations were based on exactly the same data. Therefore, whatever your interpretations, they should have been the same for all three presentations. Figure 1.1 indicates most clearly that the most justifiable interpretation is Consistent—we could even call it the correct answer. The CIs overlap very substantially, and if NHST is used to test whether there is any difference between the two studies, p = .55, so the two studies are as similar as could reasonably be expected even if the second was just a repetition of the first. The Lucky and Noluck results are entirely consistent, and therefore reinforce each other. Figure 1.2 shows the extent of reinforcement, where the CI resulting from the meta-analysis is shorter, indicating more precise estimation of the effect of the new treatment. Also the p value of .008 for the combined results would conventionally be taken as fairly strong evidence that the new treatment is more effective.
In later chapters we'll explore the definition and calculation of CIs and discuss several ways to think about them. For the moment it's worth noting two of those ways.
First, a CI indicates a range of values that, given the data, are plausible for the population parameter being estimated. Values outside the interval are relatively implausible. Any value in the interval could reasonably be the true value, and so the shorter the interval the better.
Second, CIs can, if you want, be used to carry out NHST. If zero lies within a CI, zero is a plausible value for the true effect, and so the null hypothesis is not rejected. Alternatively, if zero is outside the interval, zero is not so plausible a true value, and the null is rejected. If the intervals in Figure 1.1 are used for NHST, the results match those given in the NHST presentation: The Lucky CI...
Indice dei contenuti
Stili delle citazioni per Understanding The New Statistics
APA 6 Citation
Cumming, G. (2013). Understanding The New Statistics (1st ed.). Taylor and Francis. Retrieved from https://www.perlego.com/book/1323580/understanding-the-new-statistics-effect-sizes-confidence-intervals-and-metaanalysis-pdf (Original work published 2013)
Chicago Citation
Cumming, Geoff. (2013) 2013. Understanding The New Statistics. 1st ed. Taylor and Francis. https://www.perlego.com/book/1323580/understanding-the-new-statistics-effect-sizes-confidence-intervals-and-metaanalysis-pdf.
Harvard Citation
Cumming, G. (2013) Understanding The New Statistics. 1st edn. Taylor and Francis. Available at: https://www.perlego.com/book/1323580/understanding-the-new-statistics-effect-sizes-confidence-intervals-and-metaanalysis-pdf (Accessed: 14 October 2022).
MLA 7 Citation
Cumming, Geoff. Understanding The New Statistics. 1st ed. Taylor and Francis, 2013. Web. 14 Oct. 2022.