
eBook - ePub
Atomic Emission Spectrometry
AES - Spark, Arc, Laser Excitation
Heinz-Gerd Joosten, Alfred Golloch, Jörg Flock, Susan Killewald
This is a test
Condividi libro
- 350 pagine
- English
- ePUB (disponibile sull'app)
- Disponibile su iOS e Android
eBook - ePub
Atomic Emission Spectrometry
AES - Spark, Arc, Laser Excitation
Heinz-Gerd Joosten, Alfred Golloch, Jörg Flock, Susan Killewald
Dettagli del libro
Anteprima del libro
Indice dei contenuti
Citazioni
Informazioni sul libro
Atomic Emission Spectrometry is a powerful analytical method which is utilized in academia and industry for quantitative and qualitative elemental analysis. This publication is an excellent guide to the technique, explaining the underlying theory and covering practical measurement applications. Extremely well-written and organized, this book is a beneficial instrument for every scientist or professional working with AES.
Domande frequenti
Come faccio ad annullare l'abbonamento?
È semplicissimo: basta accedere alla sezione Account nelle Impostazioni e cliccare su "Annulla abbonamento". Dopo la cancellazione, l'abbonamento rimarrà attivo per il periodo rimanente già pagato. Per maggiori informazioni, clicca qui
È possibile scaricare libri? Se sì, come?
Al momento è possibile scaricare tramite l'app tutti i nostri libri ePub mobile-friendly. Anche la maggior parte dei nostri PDF è scaricabile e stiamo lavorando per rendere disponibile quanto prima il download di tutti gli altri file. Per maggiori informazioni, clicca qui
Che differenza c'è tra i piani?
Entrambi i piani ti danno accesso illimitato alla libreria e a tutte le funzionalità di Perlego. Le uniche differenze sono il prezzo e il periodo di abbonamento: con il piano annuale risparmierai circa il 30% rispetto a 12 rate con quello mensile.
Cos'è Perlego?
Perlego è un servizio di abbonamento a testi accademici, che ti permette di accedere a un'intera libreria online a un prezzo inferiore rispetto a quello che pagheresti per acquistare un singolo libro al mese. Con oltre 1 milione di testi suddivisi in più di 1.000 categorie, troverai sicuramente ciò che fa per te! Per maggiori informazioni, clicca qui.
Perlego supporta la sintesi vocale?
Cerca l'icona Sintesi vocale nel prossimo libro che leggerai per verificare se è possibile riprodurre l'audio. Questo strumento permette di leggere il testo a voce alta, evidenziandolo man mano che la lettura procede. Puoi aumentare o diminuire la velocità della sintesi vocale, oppure sospendere la riproduzione. Per maggiori informazioni, clicca qui.
Atomic Emission Spectrometry è disponibile online in formato PDF/ePub?
Sì, puoi accedere a Atomic Emission Spectrometry di Heinz-Gerd Joosten, Alfred Golloch, Jörg Flock, Susan Killewald in formato PDF e/o ePub, così come ad altri libri molto apprezzati nelle sezioni relative a Ciencias físicas e Química analítica. Scopri oltre 1 milione di libri disponibili nel nostro catalogo.
Informazioni
1 Introduction
1.1 Definitions
Observation of the interaction of electromagnetic radiation and matter is summarized under the term spectroscopy. In this context, matter consists of atoms, ions, molecules or combinations of such particles, such as metals or liquids. Many of the interactions involve transitions between defined energy states, which are associated with the emission of radiation. Such interactions occur only in the gas phase in free atoms or ions, which led to the terminology atomic emission spectroscopy (AES). The emitted line spectra deliver information about the chemical elements whose atoms or ions are present in the gas phase. Spectroscopy is thus suitable as an analyst’s tool. Spectrometry is a narrowing of the term spectroscopy; it is used when electromagnetic radiation is quantitatively measured.
In addition to the observable spectroscopic effects, there are interactions between radiation and matter, which are not associated with energy transitions. These interactions include refraction, diffraction, reflection and scattering, which change the direction, phase or polarization of radiation [1] (Figure 1.1).
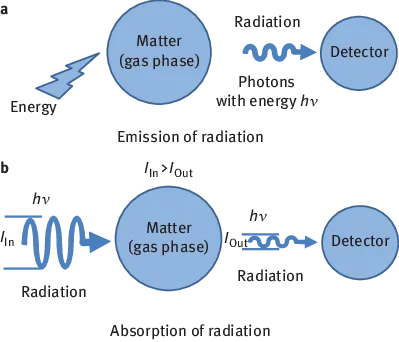
Figure 1.1: Interaction between radiation and matter.
The energy of emitted electromagnetic radiation can be distributed over a large range of frequencies (see Table 1.1). The choice of spectroscopic method determines the frequencies to be used.
Table 1.1:The electromagnetic spectrum.
| Wavelength range | λ | Transition |
|---|---|---|
| Gamma radiation | <0.005 nm | Nucleus |
| X-rays | 0.005–100 nm | Inner electrons |
| Vacuum UV | 100–180 nm | Valence electrons |
| Near UV | 180–390 nm | Valence electrons |
| Visible region | 390–770 nm | Valence electrons |
| Near infrared | 770–2,500 nm | Valence electrons and molecular vibration |
| Medium infrared | 2.5–50 µm | Molecular vibration |
| Far infrared | 50–1.000 µm | Molecular rotation |
| Microwave range | 1–1,000 mm | Molecular rotation, electron and nuclear spin |
| Radio wave range | >1,000 mm | Nuclear spin |
The line spectra ranging from 115 nm (vacuum UV) over the visible range (390–770 nm) to approximately 1,000 nm (near infrared) are evaluated in AES, which is the subject of this book.
The atoms and ions present in the gas phase can be excited in a variety of ways. Within the scope of this book, only excitation with electric spark and arc is to be discussed in detail. Excitation by laser sources is only to be marginally addressed.
1.1.1 Spectrometry for material analysis for research and production
The importance of AES is frequently underestimated as a modern method for instrumental analysis. This is difficult to understand when one realizes that 3,000–4,000 mobile and stationary spectrometers are bought and delivered every year. It is estimated that about 50,000 instruments are currently (as of 2017) in use around the world. These figures demonstrate the economic importance of arc/spark AES as an analytical tool.
The manufacture and processing of modern materials depends on competent analytics. The production process for metallic raw materials cannot be controlled without quick monitoring of the melt’s material composition. The precise production of high-quality alloys with defined proportions of alloying elements requires rapid and accurate analysis.
The processing of materials into products leads to good results when continuous quality control is ensured with the help of AES. Efficient machines and components for the aerospace and automotive industries can only be manufactured under these conditions.
Other important application areas for arc/spark AES include the following:
- Metal identification can be performed with a 100% testing of the composition of the material components.
- Recycled material can be examined to determine which materials are present. The sorted materials can be reused separately.
- Basic research on new metallic materials involves a great deal of analytical effort. Experiments for alloy composition can be supported by fast and highly sensitive arc/spark spectrometry.
AES with arc and spark offers many advantages, above all, for material analysis and especially for quality and process control, making it the method of choice [2]:
- A direct analysis of solid samples is possible without needing to dissolve them.
- Practically all relevant elements can be simultaneously determined.
- The measurement proceeds automatically and delivers the result in just a few seconds.
- Detection sensitivity and reproducibility are good.
- A wide concentration range, from traces to 100%, can be covered.
1.2 About the history of atomic emission spectrometry
1.2.1 First observations of atomic emission spectra
The first steps of AES, also frequently referred to as “spectral analysis,” began a long time ago [3].
Newton’s observation of the solar spectrum in 1672 was groundbreaking. Representation of this spectrum was performed by blocking a portion of the sunlight using a round hole and then splitting the light with a prism. The spectrum became visible on a white surface behind the prism. However, the spectrum obtained in this way offered only insufficient resolution. Important details became visible only through the use of a narrow entrance slit by Wollaston in 1802. Thin black lines could be seen within the continuous color gradient. The sunlight delivered light throughout the visible range of light, whereby the radiation is missing for various narrowly limited spectral regions. At first, there was no explanation for this phenomenon. Even Fraunhofer [4], who later examined these mysterious black lines, could only measure their positions.
It was only in 1859 after the discoveries from Bunsen and Kirchhoff that it was recognized that the lines could be assigned to chemical elements. Previously, beginning in 1820, the formation of emission spectra in flames was investigated by several researchers, who placed different chemical compounds into the flames [5, 6, 7, 8]. At that time, it was already established that this method could be used to detect the smallest of sample quantities.
At that point, electrical sparks were already being used, in addition to flames, to produce spectra [9, 10, 11, 12]. The spectra from metals as well as compounds were analyzed.
1.2.2 Fundamental work by Bunsen and Kirchhoff dealing with atomic emission spectrometry
In 1859, after a large amount of preliminary work as to the formation of spectra, Bunsen and Kirchhoff explained the basics of spectral analysis in a publication [13]. They discovered that the bright lines in the spectrum of a glowing gas are caused exclusively by its chemical components. They also determined that the chemical binding has no influence on the spectrum. Bunsen and Kirchhoff described the spectra of the alkaline and alkaline earth elements and demonstrated the detection sensitivity of spectral analysis. Using spectr...