
eBook - ePub
Economics and Transport Policy
K.M. Gwilliam, P.J. Mackie
This is a test
Condividi libro
- 398 pagine
- English
- ePUB (disponibile sull'app)
- Disponibile su iOS e Android
eBook - ePub
Economics and Transport Policy
K.M. Gwilliam, P.J. Mackie
Dettagli del libro
Anteprima del libro
Indice dei contenuti
Citazioni
Informazioni sul libro
This book, first published in 1975, discusses the development of transport policy in the UK against a background of economic theory. It comprises a comprehensive review of transport policy both in urban and inter-urban situations from an economic standpoint. It provides the tools for analysis of policy changes in the transport sector.
Domande frequenti
Come faccio ad annullare l'abbonamento?
È semplicissimo: basta accedere alla sezione Account nelle Impostazioni e cliccare su "Annulla abbonamento". Dopo la cancellazione, l'abbonamento rimarrà attivo per il periodo rimanente già pagato. Per maggiori informazioni, clicca qui
È possibile scaricare libri? Se sì, come?
Al momento è possibile scaricare tramite l'app tutti i nostri libri ePub mobile-friendly. Anche la maggior parte dei nostri PDF è scaricabile e stiamo lavorando per rendere disponibile quanto prima il download di tutti gli altri file. Per maggiori informazioni, clicca qui
Che differenza c'è tra i piani?
Entrambi i piani ti danno accesso illimitato alla libreria e a tutte le funzionalità di Perlego. Le uniche differenze sono il prezzo e il periodo di abbonamento: con il piano annuale risparmierai circa il 30% rispetto a 12 rate con quello mensile.
Cos'è Perlego?
Perlego è un servizio di abbonamento a testi accademici, che ti permette di accedere a un'intera libreria online a un prezzo inferiore rispetto a quello che pagheresti per acquistare un singolo libro al mese. Con oltre 1 milione di testi suddivisi in più di 1.000 categorie, troverai sicuramente ciò che fa per te! Per maggiori informazioni, clicca qui.
Perlego supporta la sintesi vocale?
Cerca l'icona Sintesi vocale nel prossimo libro che leggerai per verificare se è possibile riprodurre l'audio. Questo strumento permette di leggere il testo a voce alta, evidenziandolo man mano che la lettura procede. Puoi aumentare o diminuire la velocità della sintesi vocale, oppure sospendere la riproduzione. Per maggiori informazioni, clicca qui.
Economics and Transport Policy è disponibile online in formato PDF/ePub?
Sì, puoi accedere a Economics and Transport Policy di K.M. Gwilliam, P.J. Mackie in formato PDF e/o ePub, così come ad altri libri molto apprezzati nelle sezioni relative a Business e Business General. Scopri oltre 1 milione di libri disponibili nel nostro catalogo.
Informazioni
PART I
Chapter 1
A STATISTICAL INTRODUCTION TO THE TRANSPORT SECTION
As a starting point let us set out some figures which show the order of magnitude of the transport sector.
OUTPUT AND EXPENDITURE
It is difficult to elicit from national product statistics a simple figure to indicate the great importance of transport within the economy, as transport elements are included, in an undistinguished form, in the recorded outputs of so many industries (e.g. communications, distribution trades, ‘construction’, etc.). However, the identity in national income accounting between total output and total expenditure allows us to obtain the impression we require by scanning expenditure patterns. This shows, in Table 1.1, that between 15 and 20% of national expenditure is accounted for by the transport sector.
Table 1.1 Expenditure on Transport and Total Expenditure (current prices) £M
| 1960 | 1965 | 1968 | |
|---|---|---|---|
| Gross National Product at factor cost | 22,817 | 31,342 | 36,975 |
| Total users’ expenditure on road and rail transport | 3,525 | 5,395 | 6,860 |
| (15.2%) | (17.4%) | (18.5%) | |
| of which | |||
| Freight transport | 1,730 | 2,520 | 2,985 |
| Passenger transport | 1,795 | 2,875 | 3,875 |
Sources:Annual Abstract of Statistics, Table 310
Highway Statistics, 1968, Table 55
Passenger Transport in Great Britain, 1970, Table 3
Highway Statistics, 1968, Table 55
Passenger Transport in Great Britain, 1970, Table 3
The statistics of Table 1.1 relate to all transport expenditures, by both persons and firms. In terms of consumers’ expenditure only, shown in Table 1.2 the proportion is a little smaller—around 10%— though like total expenditure on transport its significance has been rising over the last decade.
Table 1.2 Consumers’ Expenditure on Transport (current prices) £M
| 1960 | 1965 | 1970 | |
|---|---|---|---|
| Private cars and motor cycles: | |||
| Purchases | 568 | 697 | 980 |
| Running costs | 454 | 912 | 1,679 |
| Total | 1,022 | 1,609 | 2,659 |
| Public transport: | |||
| Rail | 145 | 170 | 232 |
| Bus, coach, etc. | 312 | 370 | 439 |
| Other1 | 115 | 201 | 354 |
| Total | 572 | 741 | 1,025 |
| As % of total consumers’ expenditure: | |||
| Public transport | 3.4 | 3.2 | 3.3 |
| Motoring | 6.0 | 7.0 | 8.5 |
| Total | 9.4 | 10.2 | 11.8 |
1Expenditure on sea and air travel (including international travel), the hiring of taxis, and private hire vehicles.
Source: Passenger Transport in Great Britain, 1970, Table 3
CAPITAL EXPENDITURE
The importance of a sector may be gauged not only by its current expenditures but also by the share of national real investment for which it is responsible. As Table 1.3 shows, the transport industry has also taken between 15 and 20% of gross fixed capital formation during the last decade.
PUBLIC EXPENDITURE
Not only is the transport sector large, but it is one in which the government has a special role by virtue of its own direct activities.
Table 1.3 Gross Fixed Capital Formation in Transport (current prices) £M
| 1960 | 1965 | 1970 | |
|---|---|---|---|
| Buses and coaches | 22 | 29 | 42 |
| Other road vehicles | 306 | 408 | 535 |
| Railway rolling stock | 92 | 48 | 27 |
| Ships | 178 | 105 | 290 |
| Aircraft | 43 | 18 | 98 |
| Roads | 85 | 196 | 454 |
| Other rail | 78 | 74 | 66 |
| Other air and shipping | 12 | 29 | 51 |
| Harbours, canals and docks | 27 | 27 | 41 |
| TOTAL TRANSPORT | 843 | 934 | 1,599 |
| As % of TOTAL | 20.6% | 14.9% | 17.0% |
Source: Annual Abstract of Statistics, 1971, Table 323
Thus, as Table 1.4 shows, transport is responsible for between 5 and 6% of public expenditure (i.e. direct government expenditure). This does not include the current expenditures (or outputs) of the nationalised transport industry.
Table 1.4 Transport and Public Expenditure (1971 Survey prices) £M
| Provisional Outturn 1970-71 | Estimate 1975–76 | |
|---|---|---|
| Total public expenditure | 23,823 | 26,740 |
| of which | ||
| Roads and public lighting | 816.8 | 1,067 |
| Surface transport | 201.1 | 223 |
| Civil aviation and shipping | 26.5 | 25 |
| Nationalised industry capital expenditure— | ||
| Transport element | 283.8 | 272 |
| 1,328.2 | 1,587 | |
| As % of total public expenditure | (5.5%) | (6.0%) |
Source: Public Expenditure to 1975–76. Cmnd 4829, 1971
Note: This table follows the conventions of the White Paper in excluding current expenditure by nationalised industries, but including their capital expenditure, and all current expenditure directly incurred by the central government.
The overall picture, then, is that transport is a large, and still growing part of consumers’ expenditure, public expenditure and total national expenditure and that although capital expenditure is more volatile, transport consistently accounts for nearly one fifth of national gross fixed capital formation.
INDUSTRIAL STRUCTURE
To complete this introductory picture the structure of the transport sector may be summarised. For freight transport, as Table 1.5 shows, total output has been rising steadily, roughly in line with GNP over the last fifteen years. But during this period the dominance of road transport has increased substantially, both in tonnage terms (from 75 to 85%) and more significantly in ton mileage (from 40 to 60%). Rail transport of freight has declined over the period, not only in relative, but also in absolute terms. Perhaps most surprising, however, is the large, though relatively declining, ton mileage performed by coastal shipping which performs a role in the UK not dissimilar to that performed in continental countries by inland waterways.
Table 1.5 Goods Transport in Great Britain
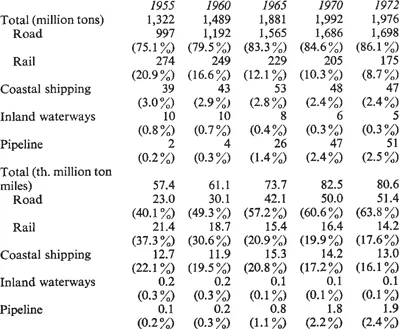
Source: Basic Road Statistics, 1973, quoting from Annual Abstract of Statistics and (1972) DOE estimates
For passenger transport, as Table 1.6 shows, the rate of growth has been even faster than that of national income, and this growth has been accounted for entirely by the growth in private road transport.
Table 1.6 Total Passenger Transport in Great Britain
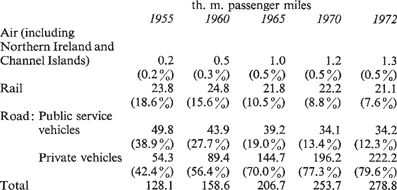
Source: Passenger Transport in Great Britain, Table I, and (1972) Annual Abstract of Statistics, 1973
Passenger mileage by rail has remained approximately stable over the last fifteen years whilst that by bus has fallen by one third. In contrast, passenger mileage by car has increased by 1970 to over 350% of the level in 1955. These changes in market share have been accompanied by changes in the relative prices of the alternatives, as shown in Table 1.7. The costs of private transport have risen less rapidly than those of public transport, particularly of bus transport. Thus even the statistics suggest a vicious circle of relative decline in quantity of public transport followed by relative increase in price and so on.
Table 1.7 Passenger Transport: Cost to the Consumer
| Index numbers of prices 1963 = 100 | |||
|---|---|---|---|
| 1960 | 1965 | 1970 | |
| Railway fares | 81 | 110 | 142 |
| Bus and coach stage service fares | 86 | 114 | 162 |
| Prices of new and secondhand cars and motor cycles | 115 | 99 | 117 |
| Running costs of motor vehicles | 93 | 109 | 137 |
| Total consumer expenditure on all goods and services | 92 | 106 | 134 |
Source: Passenger Transport in Great Britain, Table 4
These price trends for different kinds of transport service depend crucially on the prices of factor inputs. The relative increase of rail and bus fares over the decade is largely due to their relative labour intensiveness in a period of rising real wages. For the future there are two resource inputs, energy and land, which appear to be likely to command increased real prices. It is instructive, in conclusion of this chapter to look at the relative consumption of these inputs by various transport modes (Table 1.8).
Table 1.8 Transport Outputs per Unit of Selective Resource Inputs
| LAND | FUEL | ||
|---|---|---|---|
| Passenger miles/hr/acre | Passenger miles/therm | Ton miles/therm | |
| Cara | 3,100 | 17.8 | — |
| Busb | 28,900 | 147.0 | — |
| Railb | 10,100 | 153.0 | 66.7 |
| Heavy load goods vehicle | — | — | 100.0 |
| Conventional aircraftc | 8,700 | 21.0 | 11.2 |
Source: Derived from I. C. Cheeseman; Transport Technology, A Hope for the Future’: University Transport Studies Group Conference, London, January 1973
Notes: aAssuming a load factor of 1.4 passengers per car, and 25 miles per gallon.
bAssuming 60 % load factor.
cAssuming 60 % load factor and 200 mile stage lengths.
In terms of use of land and fuel, public transport is clearly less prodigal than private transport. As between road and rail mode of public transport, however, there is less to choose and the differences shown in the table are likely to lie within the range of error of the assumptions concerning performance and load factors.
The picture that emerges from these statistics is that of a sector which has been growing very rapidly over the last quarter of a century, which has been experiencing very radical changes in structure and which might expect further changes in the future as the world resource situation changes.
Chapter 2
ECONOMIC OBJECTIVES
Formal definitions are not always particularly useful. Many things are easy to recognise but difficult to describe precisely and without ambiguity. Economics in general, and transport economics in particular, is a bit like that. So although we shall begin with a formal definition of our subject we shall only...