
eBook - ePub
Experimental Design in Biotechnology
Perry D. Haaland
This is a test
Condividi libro
- 284 pagine
- English
- ePUB (disponibile sull'app)
- Disponibile su iOS e Android
eBook - ePub
Experimental Design in Biotechnology
Perry D. Haaland
Dettagli del libro
Anteprima del libro
Indice dei contenuti
Citazioni
Informazioni sul libro
This book provides the first time user of statistics with an understanding of how and why statistical experimental design and analysis can be an effective problem solving tool. It presents experimental designs which are useful for small screening and response surface experiments.
Domande frequenti
Come faccio ad annullare l'abbonamento?
È semplicissimo: basta accedere alla sezione Account nelle Impostazioni e cliccare su "Annulla abbonamento". Dopo la cancellazione, l'abbonamento rimarrà attivo per il periodo rimanente già pagato. Per maggiori informazioni, clicca qui
È possibile scaricare libri? Se sì, come?
Al momento è possibile scaricare tramite l'app tutti i nostri libri ePub mobile-friendly. Anche la maggior parte dei nostri PDF è scaricabile e stiamo lavorando per rendere disponibile quanto prima il download di tutti gli altri file. Per maggiori informazioni, clicca qui
Che differenza c'è tra i piani?
Entrambi i piani ti danno accesso illimitato alla libreria e a tutte le funzionalità di Perlego. Le uniche differenze sono il prezzo e il periodo di abbonamento: con il piano annuale risparmierai circa il 30% rispetto a 12 rate con quello mensile.
Cos'è Perlego?
Perlego è un servizio di abbonamento a testi accademici, che ti permette di accedere a un'intera libreria online a un prezzo inferiore rispetto a quello che pagheresti per acquistare un singolo libro al mese. Con oltre 1 milione di testi suddivisi in più di 1.000 categorie, troverai sicuramente ciò che fa per te! Per maggiori informazioni, clicca qui.
Perlego supporta la sintesi vocale?
Cerca l'icona Sintesi vocale nel prossimo libro che leggerai per verificare se è possibile riprodurre l'audio. Questo strumento permette di leggere il testo a voce alta, evidenziandolo man mano che la lettura procede. Puoi aumentare o diminuire la velocità della sintesi vocale, oppure sospendere la riproduzione. Per maggiori informazioni, clicca qui.
Experimental Design in Biotechnology è disponibile online in formato PDF/ePub?
Sì, puoi accedere a Experimental Design in Biotechnology di Perry D. Haaland in formato PDF e/o ePub, così come ad altri libri molto apprezzati nelle sezioni relative a Mathematics e Mathematics General. Scopri oltre 1 milione di libri disponibili nel nostro catalogo.
Informazioni
Chapter 1 STATISTICAL PROBLEM SOLVING
For most bioprocess technologies there are no theoretical models which can be used to explain process performance. Consequently, successful research is characterized by effective empirical problem solving. Typically, the problem solving process is governed by limitations on time and resources. Therefore, research productivity is a critical concern. Statistical problem solving provides a set of powerful tools which can be used to maximize the efficiency and productivity of empirical problem solving.
1.1 Collecting information-rich data
Research in biotechnology generates great quantities of data. The recent spread of computers in the research environment has greatly increased our ability to collect and manage this data. However, although computers increase the amount of data we can create and manage, they do not necessarily increase the information in the data. Since there are limited time and resources available to generate and understand this data, it is important that the data be information-rich. Statistical experimental design is one way to increase the amount of information-rich data we collect.
Purpose of collecting data
Data is collected to solve empirical problems. Data serve as a basis both for understanding and for action. Some typical reasons for collecting data for empirical problem solving are as follows:
- determine which few out of many variables significantly affect process performance
- determine how the settings of the variables should be changed in order to improve the process performance
- determine the optimal process performance level and specify what actions must be taken to achieve this level.
These reasons for collecting data have long been a part of statistical methodology. Methods for their use were described, for example, in the books Design and Analysis of Industrial Experiments by Owen L. Davies (1956), Applications of Statistics to Industrial Experimentation by Cuthbert Daniel (1976), Statistics for Experimenters by George E. P. Box, William G. Hunter and J. Stuart Hunter (1978), and Practical Experimental Design by William Diamond (1981). In this book, we use the power of real examples to show how these statistical problem solving methods can be applied to the collection and analysis of data from biotechnology experiments.
How should data be collected?
Every experiment has a design. Some designs are better than others. Since data must be collected anyway, the use of statistically designed experiments for data collection adds only incrementally to its cost. However, well designed experiments significantly increase the information content of the data.
Since data serve as the basis for understanding and action, it is essential to have correct data to make correct decisions. In Guide to Quality Control, K. Ishikawa (1976) outlined the following considerations in collecting data:
- "Will the data determine the facts?"
- "Are the data collected, analyzed and compared in such a way as to reveal the facts?"
The first consideration relates to experimental design while the second deals with statistical analysis. However, data which are collected properly are usually simple to analyze and understand.
The first step in the proper collection of data is to clarify the objectives of the experiment. Next the experimenter must determine what data to collect, how to measure it, and how the data relate to process performance and experimental objectives. The experimenter must ensure that the data collected are representative of the process so that the data will lead to correct conclusions. Finally, an experimental design must be chosen which will reveal the facts as they relate to the experimental objectives.
What is an experimental design?
An experimental design is a collection of predetermined settings of the process variables. Each process variable is called an experimental factor. Each combination of settings for the process variables is called a run. A response variable is a measure of process performance. Each value of the response variable is called an observation. For example, for a process which depends on pH and incubation time, a possible experimental design is as follows:
- run 1: pH=6.7, time=20 minutes;
- run 2: pH=6.7, time=30 minutes;
- run 3: pH=7.2, time=20 minutes;
- run 4: pH=7.2, time=30 minutes.
At each of these runs, process performance would be observed. The resulting data set would provide information about how pH and time affect process performance and what can be done to improve process performance.
Progress on the learning curve
Empirical problem solving is difficult because the problems are complex and progress along the learning curve is often slow and difficult. The use of statistical experimental design speeds progress along the learning curve because these experiments are very effective in answering questions. (See Figure 1.1) This sounds simple, but anyone who has carried out an experiment, examined the results, and then was unable to provide any clear answers can appreciate the fundamental importance of this idea.
1.2 Separating signals from the noise
Data represent a combination of signals and noise. A signal is an indication of the effect that a process variable has on process performance. In a properly designed experiment, any factor which has an important effect on process performance will generate a signal which is large in comparison to the noise. Unimportant factors will have signals which fall below the noise level. The noise is all of the other variation in the data. Statistical methods can be used to separate the signals from the noise.
Noise
If we repeat a biological experiment, we don’t expect to get exactly the same results as in the first experiment. This is true even if we are very careful to run each experiment under controlled conditions. The differences between experiments contribute to the uncertainty about the true results. Statistical methods allow us to reason in the presence of this uncertainty.
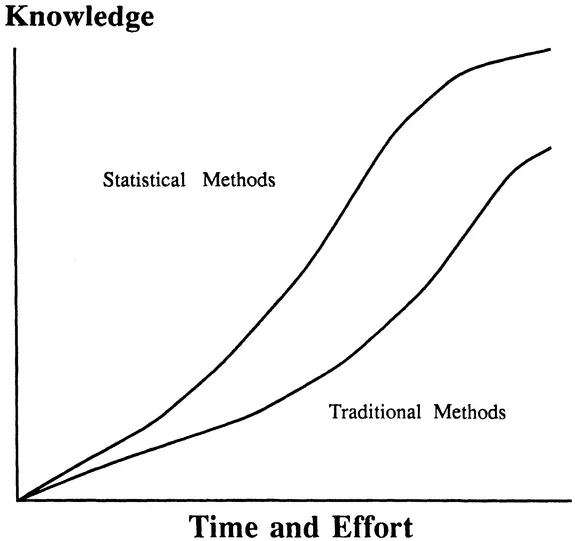
Figure 1.1 A learning curve measures how much time and effort it takes to acquire knowledge about the problem being studied. Statistical methods provide an advantage over traditional problem solving methods such as "one-factor-at a-time" or haphazard experimentation because statistical methods focus on small, well designed experiments which answer questions about the process being studied. This results in a steeper learning curve and faster progress toward the problem solution.
Uncertainty stems from variability in measurements of process performance. Variability can be thought of in terms of two components; namely, experimental error and measurement error. Measurement error is the variability observed when remeasuring the same experimental outcome. Experimental error is the difference in outcomes when an experiment is independently repeated under controlled conditions. Experimental error is usually much larger than measurement error. When we refer to noise, we are usually referring to the sum of both experimental and measurement error.
Clear signal designs
Experimenters can often identify many factors which may affect a process, but they usually have limited resources to carry out their experiments. Therefore, the use of small experiments is especially attractive. However, special care must be taken in using a small experiment under these conditions so that meaningful results will be achieved.
For example, in formulating a new assay buffer, the experimenter needs to be confident that, say, the effect of pH can be clearly separated from the effect of ionic strength. If, for the purposes of economy, the process is only observed with pH and ionic strength both at low levels or both at high levels, then the effects of these two factors cannot be separated. However, if all four combinations of high and low levels were observed, then the effects of the two factors would be clearly separated.
In order to conduct efficient experiments, we want to study as many experimental factors as we can with the fewest number of observations. As the number of factors increases, it becomes more difficult to choose combinations of their levels which clearly separate their effects yet at the same time minimize the size of the experiment.
The Design Digest, at the end of this book, is a collection of efficient experimental designs which allow many factors to be investigated in small experiments. These designs can be characterized as "clear signal" designs (J. Stuart Hunter, 1987). That is, when used properly, they
- separate the signals from the noise and
- clearly distinguish signals from each other.
These designs form the basis for efficient, effective statistical problem solving.
The Pareto Principle
A statistical analysis provides estimates of how strongly each experimental factor affects process performance. These estimates reveal which factors are most important and how changing their settings affects process performance. An interesting way to compare the relative importance of the estimated effects of the factors is by means of a Pareto chart (Ishilcawa, 1976).
The Pareto chart in Figure 1.2 graphically displays the magnitudes of the effects from a data set which is analyzed in Chapter 4. The effects are sorted from largest to smallest. The Pareto chart clearly shows that the first effect is by far the most important one. The second effect also seems to be above the noise level but is much smaller. In Chapter 4, statistical methods are presented for determining which, if any, of the remaining effects are important.

Figure 1.2 A Pareto chart for the results of an experimental design graphically depicts the relative magnitudes of the effects of each of the experimental factors. The y-axis shows the experimental factors (and possibly their interactions). The x-axis shows the absolute magnitude of the effect of each factor as determined by the statistical analysis. The Pareto Principl...