eBook - ePub
Asian Economic Integration Report 2022
Advancing Digital Services Trade in Asia and the Pacific-Main Report
This is a test
Condividi libro
- 300 pagine
- English
- ePUB (disponibile sull'app)
- Disponibile su iOS e Android
eBook - ePub
Asian Economic Integration Report 2022
Advancing Digital Services Trade in Asia and the Pacific-Main Report
Dettagli del libro
Anteprima del libro
Indice dei contenuti
Citazioni
Informazioni sul libro
Another year into the coronavirus disease (COVID-19) pandemic, this report describes an Asia and Pacific region that has more experience in tackling pandemic hardships, better data showing positive integration trends, and greater confidence in regional cooperation to address shared concerns. As rapid digitalization and the COVID-19 pandemic are spurring growth of digital services trade in Asia and the Pacific, the theme chapter explores how the region can capitalize on greater opportunities for digital services trade through structural reforms and international cooperation.
Domande frequenti
Come faccio ad annullare l'abbonamento?
È semplicissimo: basta accedere alla sezione Account nelle Impostazioni e cliccare su "Annulla abbonamento". Dopo la cancellazione, l'abbonamento rimarrà attivo per il periodo rimanente già pagato. Per maggiori informazioni, clicca qui
È possibile scaricare libri? Se sì, come?
Al momento è possibile scaricare tramite l'app tutti i nostri libri ePub mobile-friendly. Anche la maggior parte dei nostri PDF è scaricabile e stiamo lavorando per rendere disponibile quanto prima il download di tutti gli altri file. Per maggiori informazioni, clicca qui
Che differenza c'è tra i piani?
Entrambi i piani ti danno accesso illimitato alla libreria e a tutte le funzionalità di Perlego. Le uniche differenze sono il prezzo e il periodo di abbonamento: con il piano annuale risparmierai circa il 30% rispetto a 12 rate con quello mensile.
Cos'è Perlego?
Perlego è un servizio di abbonamento a testi accademici, che ti permette di accedere a un'intera libreria online a un prezzo inferiore rispetto a quello che pagheresti per acquistare un singolo libro al mese. Con oltre 1 milione di testi suddivisi in più di 1.000 categorie, troverai sicuramente ciò che fa per te! Per maggiori informazioni, clicca qui.
Perlego supporta la sintesi vocale?
Cerca l'icona Sintesi vocale nel prossimo libro che leggerai per verificare se è possibile riprodurre l'audio. Questo strumento permette di leggere il testo a voce alta, evidenziandolo man mano che la lettura procede. Puoi aumentare o diminuire la velocità della sintesi vocale, oppure sospendere la riproduzione. Per maggiori informazioni, clicca qui.
Asian Economic Integration Report 2022 è disponibile online in formato PDF/ePub?
Sì, puoi accedere a Asian Economic Integration Report 2022 di in formato PDF e/o ePub, così come ad altri libri molto apprezzati nelle sezioni relative a Politics & International Relations e Local & Regional Planning Public Policy. Scopri oltre 1 milione di libri disponibili nel nostro catalogo.
Informazioni
1 Fragile, Uneven Recovery amid the Pandemic

Asia and Pacific economies ramped up COVID-19 vaccinations in 2021, but remain behind other regions.
The surge in coronavirus disease (COVID-19) cases from the second half of 2021 as more transmissible COVID-19 variants spread underlines the importance of speeding and scaling up vaccination programs in the region. Immunization of a large proportion of the population remains the key policy priority for ending the ongoing health crisis and preventing the emergence of more virulent strains which may threaten the efficacy of existing vaccines. High immunization rate will allow gradual and steady reopening of economies, which will support strong and stable economic recovery. But the gradual reopening of economies and borders were stopped toward the end of 2021 as economies, including those in Asia and the Pacific, prevented the spread of the Omicron variant.
As of 31 December 2021, about 69% of people in Asia and the Pacific were either fully or partially vaccinated. The region was behind North America at 74% and Latin America at 70%, but was ahead of Europe, the Middle East, and Africa (Figure 1.1). Within Asia and the Pacific, the East Asia subregion recorded the highest vaccination rate at more than 86% (Figure 1.2), followed by Australia and New Zealand at 80%, Southeast Asia at 61%, South Asia at 57%, and Central Asia at 48% of their total population fully or partially vaccinated. The Pacific subregion had vaccinated only 14% of its population as of third week of December 2021.
Figure 1.1: COVID-19—Vaccinated People, by Region (% of population)
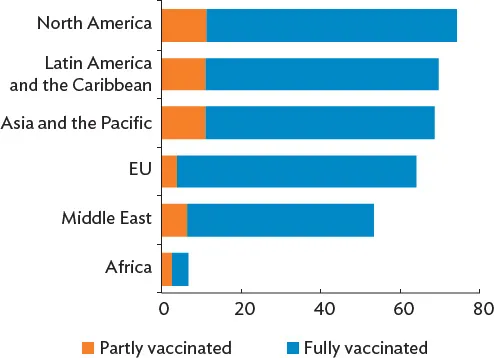
COVID-19 = coronavirus disease, EU = European Union (27 members).
Note: Data are as of the end of December 2021, except for the Pacific, which is as of the third week of December 2021.
Source: ADB calculations using data from Our World in Data and United Nations downloaded from CEIC Data Company.
Figure 1.2: COVID-19—Vaccinated People, by Subregion in Asia and the Pacific (% of population)
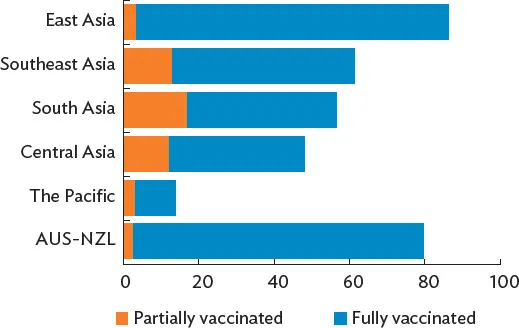
AUS = Australia, COVID-19 = coronavirus disease, NZL = New Zealand.
Note: Data are as of the end of December 2021, except for the Pacific, which is as of the third week of December 2021.
Source: ADB calculations using data from Our World in Data and United Nations downloaded from CEIC Data Company.
The pace of COVID-19 inoculation had gained speed in the second half of 2021 (Figure 1.3). Thirteen of the top 50 economies with highest daily vaccinations per million people as of 31 December 2021 are in Asia and the Pacific. Nonetheless, some economies such as Bhutan, Kazakhstan, Nauru, Papua New Guinea, and Samoa have continued to lag. Continuous and increasing access to COVID-19 vaccines remains a priority for the region along with better information sharing among economies, use of granular or localized quarantine measures, and increasing the capacity of health-care systems, more so as new COVID-19 variants spread.
Figure 1.3: COVID-19—Daily Vaccinations per Million People (latest 7-day rolling average for December 2021)

COVID-19 = coronavirus disease.
Notes: Red bars are Asia and Pacific economies. Data are as of the end of December 2021, except for Tonga, which is as of the third week of December 2021.
Source: Our World in Data downloaded from CEIC Data Company.
While merchandise trade and financial investment flows have improved, trade in services and cross-border movement of people remain sluggish.
The region’s total merchandise trade recovered in the first half of 2021, growing by around 31% compared with the same period in the previous year for selected Asia and Pacific economies (Figure 1.4). The strong recovery in merchandise trade reflects base effects from the trade decline due to strict lockdown measures in the prior year as well as improvement in external demand in the first half of 2021. However, merchandise trade growth slowed in the second half as regional economies imposed enhanced quarantine measures to suppress the rise of new COVID-19 variants and as global supply disruptions intensify. Merchandise trade in the third quarter of 2021 grew by 27.1% from the same quarter of 2020.
Figure 1.4: Merchandise Trade Growth—Selected Asia and Pacific Economies (year-on-year, %)
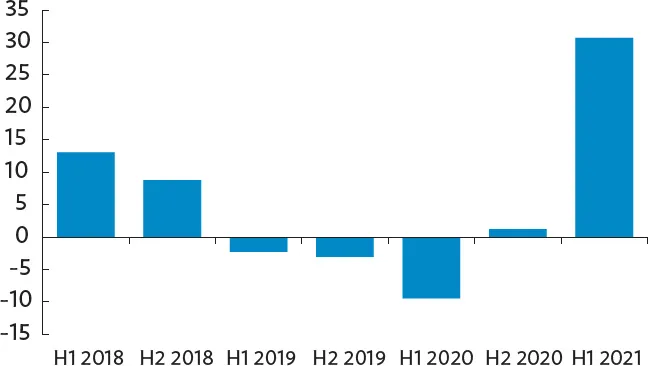
H = half.
Notes: Merchandise trade is the sum of exports and imports. Asia and the Pacific includes Armenia; Australia; Azerbaijan; Bangladesh; Brunei Darussalam; Cambodia; Georgia; Hong Kong, China; India; Indonesia; Japan; Kazakhstan; the Kyrgyz Republic; Malaysia; Mongolia; Myanmar; Nepal; New Zealand; Pakistan; the People’s Republic of China; the Philippines; the Republic of Korea; Singapore; Sri Lanka; Taipei,China; Tajikistan; Thailand; Uzbekistan, and Viet Nam.
Source: ADB calculations using data from CEIC Data Company.
Foreign direct investment (FDI) in the region continued to rise (Figure 1.5). In the first quarter of 2021, the region’s FDI inflows reported in the Balance of Payments and International Investment Position Statistics and national sources amounted to more than $212 billion, a 60% increase from the same period in 2020.1 The increase in FDI inflows reflected the high volume of mergers and acquisitions. The region’s reported inward FDI growth was larger than for selected economies in other regions including North America and South America. FDI inflows slightly dipped to $182 billion in the third quarter of 2021, but still outpaced those in the same period of 2020 by 4%. The resilience of FDI inflows to Asia and the Pacific mirrors the region’s attractiveness as an investment destination and its stronger economic growth prospects compared with other regions.
Figure 1.5: Inward Foreign Direct Investment—Selected Asia and Pacific Economies ($ billion)
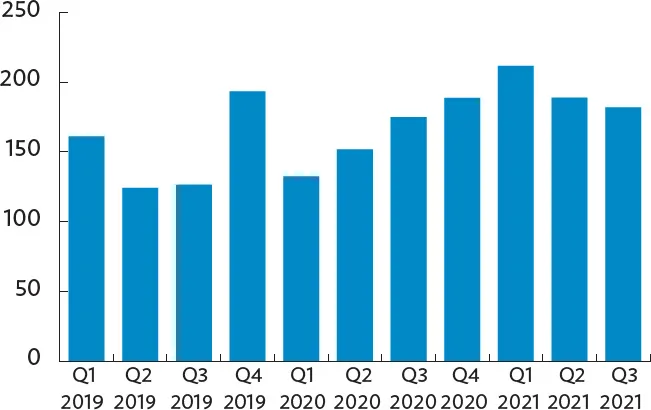
Q = quarter.
Note: Asia and the Pacific includes Armenia; Australia; Azerbaijan; Bangladesh; Brunei Darussalam; Cambodia; Georgia; Hong Kong, China; India; Indonesia; Japan; Kazakhstan; the Kyrgyz Republic; the Lao People’s Democratic Republic; Malaysia; Mongolia; Myanmar; New Zealand; Pakistan; the People’s Republic of China; the Philippines; the Republic of Korea; Singapore; Sri Lanka; Taipei,China; Thailand; Uzbekistan; and Viet Nam.
Source: ADB calculations using data from CEIC Data Company.
Nonresident portfolio inflows for selected Asia and Pacific economies continued to improve in the second quarter (Q2) of 2021 after reporting outflows in Q1 2020 (Figure 1.6). Nonresident debt securities or bond flows registered consecutive quarterly inflows from the second quarter of 2020 through the same quarter of 2021. Nonresident portfolio equity flows, likewise, mostly reported inflows with the exception of the third quarter of 2020, when outflows were last recorded. Positive economic growth outlook and commodity price increases sustained nonresident portfolio inflows. Cross-border financial transactions, specifically remittances, also improved in 2021 (Figure 1.7). Remittances in the first 10 months of 2021 grew for most of the selected Asia and Pacific economies. But for some, remittances declined in the same period the year before. Other regions, such as Latin America and the Caribbean, also reported rising remittances. The expected rise in remittances for 2021 might be due to the economic recovery in host economies and the shift from cash to digital transfers as well as from informal to formal channels (Oxford Business Group 2021).
Figure 1.6: Nonresident Portfolio Inflows—Selected Asia and Pacific Economies ($ billion)
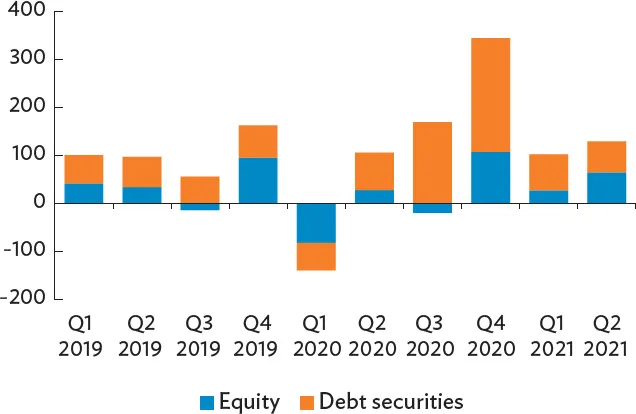
Q = quarter.
Note: Asia and the Pacific includes Armenia; Australia; Azerbaijan; Bangladesh; Brunei Darussalam; Cambodia; Georgia; Hong Kong, China; India; Indonesia; Japan; Kazakhstan; the Kyrgyz Republic; the Lao People’s Democratic Republic; Malaysia; Mongolia; Myanmar; New Zealand; Pakistan; the People’s Republic of China; the Philippines; the Republic of Korea; Singapore; Sri Lanka; Taipei,China; Thailand; and Uzbekistan.
Source: ADB calculations using data from CEIC Data Company.
Figure 1.7: Monthly Remittances Growth—January–October 2021 (year-to-date, %)
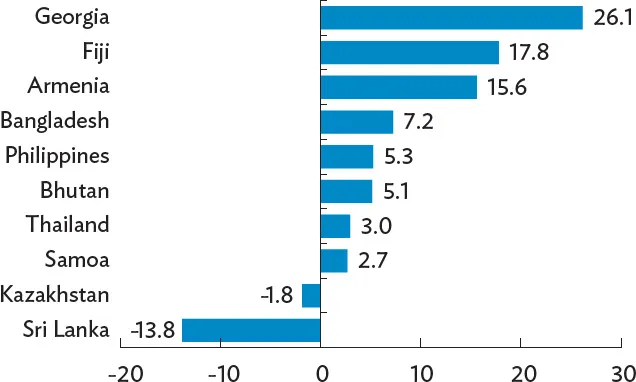
Note: Data for Bhutan and Kazakhstan cover the period until July and September, respectively.
Source: ADB calculations using data from national sources.
On the contrary, the region’s trade in services continued to be weak in 2021 (Figure 1.8). Specifically, total trade in services for selected Asia and Pacific economies reached $624 billion in the first quarter of 2021 and $655 billion in the second quarter, both higher than $610 billion recorded in the final quarter of 2020. But these values were way below the pre-pandemic quarterly average value of about $754 billion from 2018 to 2019. Among the categories of trade in services, cross-border travel continued to fall the most in 2021, reaching $57 billion and $53 billion in the first and second quarters of 2021, both significantly below the pre-pandemic quarterly average value of $221 billion. In contrast, telecommunications, computer, and information trade services continued to rise during the pandemic up to 2021, from quarterly average value of about $67 billion in 2018 to 2019 to about $80 billion in 2020 to 2021.
Figure 1.8: Trade in Services for Selected Asia and Pacific Economies ($ billion)

Q = quarter.
Notes: Trade in services is computed as trade in services credits plus debits. Asia and Pacific economies include Armenia; Australia, Cambodia; Fiji; Georgia; Hong Kong, China; India; Indonesia; Japan; Kazakhstan; Malaysia; Nepal; New Zealand; Pakistan; the People’s Republic of China; the Philippines; the Republic of Korea; Singapore; Taipei,China; and Thailand.
Source: ADB calculations using data from International Monetary Fund. Balance of Payments and International Investment Position Statistics. https://data.imf.org/BOP (accessed January 2022).
Among cross-border activities, tourist arrivals in Asia and the Pacific remained depressed in 2021. According to United Nations World Tourism Organization (UNWTO) November 2021 report, 30 destinations in the region stayed completely closed, 9 were partially closed, and 10 have compulsory testing and quarantine measures as the spread of COVID-19 variants prompted authorities to take a more cautious approach in opening their economies to foreign tourists (UNWTO 2021). Moreover, there was clear divergence in tourist arrivals within the region (Figure 1.9). In the second half of 2021, several destination economies, including Australia; Cambodia; New Zealand; and Taipei,China experienced continued declines in tourist arrivals compared with the first half of 2021; while improvements were seen in Georgia; Hong Kong, China; Japan; the Republic of Korea; and Singapore.
Figure 1.9: International Tourist Arrivals (April 2020 = 100)

Source: ADB calculations using data from CEIC Data Company and national so...