Until yesterday it seemed the issue of growth only affected poor countries, but the crisis that has been going on since 2007 reveals how the issue concerns "advanced" economies as well. As a matter of fact, growth was a problem already before the crisis: it was a real enigma. For more than half a century, advanced economies have been growing at an increasingly slower pace, and they have been doing so with very different growth rates between one another. What is the secret of growth? What evil force is undermining wealthy countries? And what is the key that allows some of them to keep growing despite it all? Ricolfi's book seeks to answer these questions, ultimately finding an equation - the growth equation - that not only explains why things went as they did, but also leaves us with a message: no country is trapped in its own destiny, the only way a country can fight its tendency to slow down is by improving its own fundamentals. The growth equation points us to what we need to change and what to expect from each of those changes. And in the case of our country, Italy, it also tells us that we can't put them off anymore.

- 272 pagine
- Italian
- ePUB (disponibile su mobile)
- Disponibile su iOS e Android
eBook - ePub
Informazioni su questo libro
Scelto da 375,005 studenti
Accesso a oltre 1,5 milioni di titoli a un prezzo mensile trasparente.
Studia in modo più efficiente con i nostri strumenti dedicati.
Informazioni
Argomento
EconomiaCategoria
Politica economicaChapter 1
The decline in numbers
4-3-2-2-1… At first this combination of numbers may seem like a tactical formation, like the ones used in soccer. But these figures actually represent the summary of half a century of economic history. Of our history: the history of “advanced economies,” the club1 of the 34 wealthiest nations in the world gathered under the banner of the Organisation for Economic Co-operation and Development (OECD).2 Together, they produce almost 50% of the world’s GDP with less than 18% of the global population.
The 4-3-2-2-1 sequence sums up in a few stylized figures the trend experienced by these high-income economies over the last fifty years, from the early Sixties to just after 2010.
The core3 of the OECD countries was growing at a 4% rate during the Sixties. With the oil crisis and the inflation of the Seventies, GDP per capita decreased a little bit, just shy of 3%. In the next two decades, a period marked by liberal policies (with Reagan and Thatcher) and globalization, the growth rate slowed down further: it was just above 2% in the Eighties, and just below 2% in the Nineties. Finally, during the initial decade of the 21st century the growth rate decreased by yet another point, bringing us below the 1% rate. The crisis that started in 2007 contributed to further slowing down the economy; the decelerationprocess, however, was already in progress before the beginning of this economic downturn (see figure 1).
As a matter of fact, we can compare the growth rate of the first seven years of the 21st century (the period between 2000 and 2007, so the pre-crisis years) with the last seven years of the 20th century (the period from 1993 to 2000). By doing so, we can ascertain that the deceleration of the growth rate in advanced economies between the last decade of the former century and the first decade of the new one was a trend that existed already before the crisis. Between 1993 and 2000, the growth rate was 2.7%, while during the period between 2000 and 2007 it was 1.9%. Basically, in less than a decade, and even before the beginning of this major crisis, the velocity of growth among advanced economies had already shrunk by almost an entire percentage point, losing about a third of its speed.4
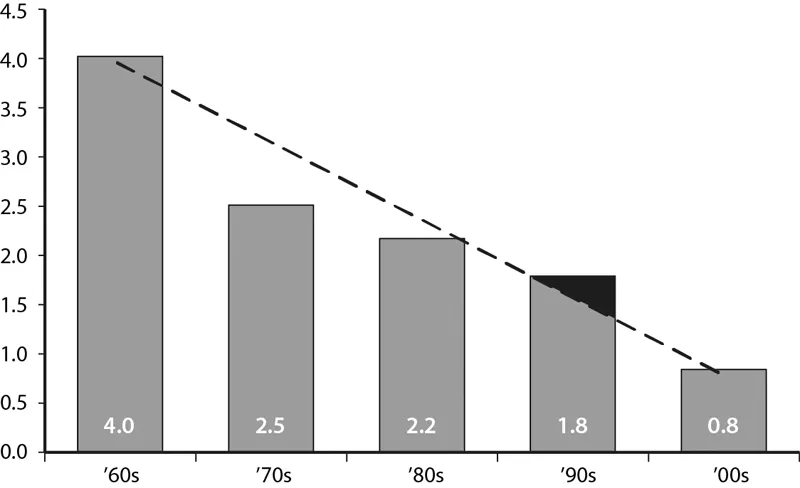
Figure 1 – The growth rate of advanced economies (the 22 members of the OECD)
We can summarize these basic facts by saying that advanced economies, considered as a whole, lose speed at the rate of about a point per decade. This trend has been going on for almost half a century. There are only two minor exceptions to this overall tendency: the Seventies are located slightly below the trend line, while the Nineties are just above it. In other words: we are growing ever more slowly, but this deceleration was particularly dramatic during the Seventies, while during the Nineties we almost managed to sustain the rhythm from the previous decade. We will see the possible reasons for this little anomaly toward the end of this book.
The decline of advanced economies is a worrisome factor: not only has it been going on for over half a century, but it has also been unfolding at a fast and seemingly relentless rhythm. If the trend of these last fifty years continues, then we can expect a growth rate close to zero in the next ten years. The picture is even more depressing if we look away from our countries (the so-called advanced economies) and start looking at all the other nations. For instance, we could ask ourselves if this deceleration process also affects other countries, both the poorer ones and the emerging economies. Getting complete and reliable data on all the countries in the world for half a century is a harrowing task, but something can still be done with the existing databases. If we work on the core of the OECD countries and compare them to the “other” ones (the group of all the non-OECD countries for which we have a complete sets of data for the last fifty years),5 the picture portrayed by the latter group is quite different from the one displayed by advanced economies. For three decades, from 1960 to 1990, GDP per capita of the “others” (the non-OECD countries) grew at a relatively stable rate6 close to 2.5%. Then, more or less around the time globalization took off, their growth rate increased substantially reaching 3.2% in the Nineties and 5.4% in the following decade: a rhythm which the group of advanced economies had never managed to sustain. In summary, while the advanced economies’ long-term trend has been slowing down, the one for the developing economies has been accelerating.
To gain a clearer understanding of this half century of economic history, rather than comparing growth rates across the various decades, we worked directly on the gap: on the ratio between GDP per capita in the various OECD and non-OECD countries (see figure 2).
Even just a glance at this graph is enough to immediately understand how things have been going. The last fifty years are clearly divided in three phases, separated by two historic dates: 1968 rattled Western economies, and 1989 turned the communist world upside-down.
During the first phase (from 1960 to 1968), the advantage of high-income economies grew even further, widening the gap from 7.3 to 8.7, an unparalleled record in history. This meant that, at the pinnacle of their growth, OECD countries had an income per capita almost ten times bigger than non-OECD countries. The gap doesn’t seem to have a uniform trend during the middle phase (from the 1968 “revolution” to the one in 1989): the discrepancy decreased at first (between 1968 and 1982), but then started increasing again between 1982 and 1989, albeit without reaching the levels attained in 1968. Finally, the last phase is dominated by a sharp decline as the gap dropped from 8.5 in 1989 to 4.5 in 2011, shrinking to half its size in just over twenty years.
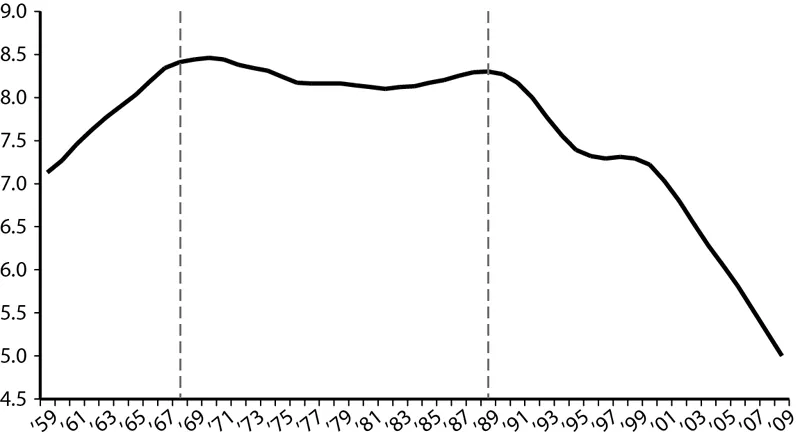
Figure 2 – The gap between advanced economies and rest of the world (moving averages)
We could discuss at length whether the turning point when advanced economies started growing less than poorer economies took place in 1968 or in 1989. A lot depends on the sources employed, on the definition of advanced economies, and especially on the countries included in the analysis.7 But the fact remains that, after 1989, the gap started shrinking incredibly fast, taking only one short break in the three years between 1996 and 1999.
This story shouldn’t be that surprising after all. In essence, the last half-century was characterized at first by a rapidly growing inequality between countries, and then by its decrease. True, we often hear that inequality is growing around the world, and even that the unrestrained increase of inequality is the ultimate cause of the current crisis. But the reality of the matter is that we cannot know for sure if the overall inequality has increased or not because we do not have reliable data on domestic inequality for all the countries in the world (over two hundred).8 We can, however, accurately reconstruct the evolution of the level of inequality between all the countries in the world from 1960 to today, measured as usual with the Gini index9 (see figure 3).
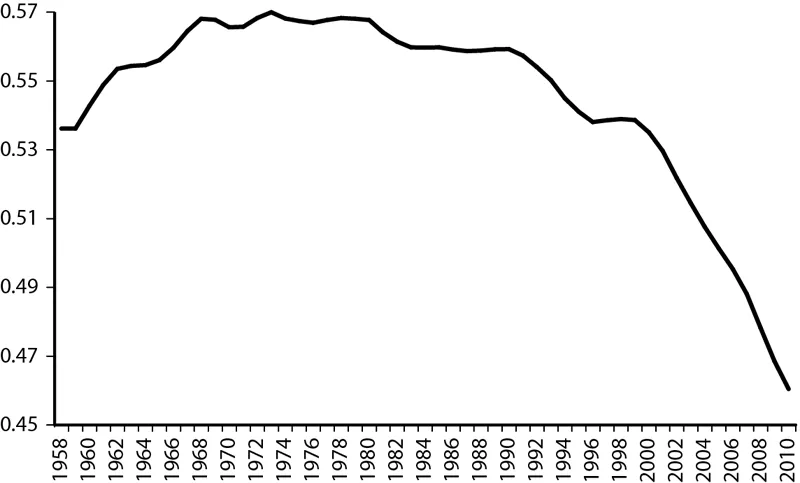
Figure 3 – The curve of inequality between States
The pattern could not be clearer. The evolution of the level of inequality between countries’ income per capita follows a parabola: it initially increased fast,then it started slowing down until it reached the Seventies, after which it began its descent, slowly at first but progressively steeper. This curve should seem familiar: Kuznets had foreseen this trend already back in the Fifties in relation to the evolution of a country’s domestic inequality.10 As it turns out, Kuznets’s law (or something that closely resembles it) can also be applied to the world as a whole.
The fact that the countries ahead run slower than the ones behind is not a problem in itself: as a matter of fact, it could be seen as something positive, like a balancing mechanisms between wealthy nations and poorer ones. The issue isn’t the decrease in inequality per se, but how it is happening: not only are advanced economies running slower than the others, but they are also running less than they were in the past, and they are getting progressively slower. The 4-3-2-2-1 pattern demonstrates that this deceleration started at least forty years ago, losing about 0.1% every year, which translates more or less to an entire point every decade. Therefore, advanced economies were already dangerously close to stagnation before the crisis of 2007-2013, at a time when many of them were crushed by an enormous public and private debt. This is especially true for the eurozone: not only are these countries the slowest in the OECD, but the financial markets also treat them worse than other countries. It might seem peculiar, but data from these recent years shows rather unequivocally that the “spread equation” is completely different for countries with a central bank (like Japan, the United States, and the United Kingdom) compared to the seventeen eurozone nations, which do not have a real central bank per se. While interest rates in the former group largely depend on inflation, for the latter they are extremely sensitive to growth rates: if a country has discrete growth prospects, then markets will tolerate its high public debt; but if its growth prospects are negative, financial markets will be extremely stingy.11 Consequently, the only economies with high public debt that can afford the luxury of non-growth are countries endowed with a real central bank. Everyone else needs to take into serious consideration the 4-3-2-2-1 sequence and the future of zero-growth that it seems to entail.
When faced with such dramatic figures, one could think that the literature on economic growth would have focused already decades ago on the problem of the rapid decline of advanced economies. But it wasn’t so. In a way, it is the exact opposite. Many empirical studies on the factors determining economic growth have been written in the past twenty years in the wake of the groundbreaking work carried out by Robert Barro and Xavier Sala-i-Martin. These studies have almost always focused on another issue: discovering the conditions that would allow developing countries to chase after advanced economies, and to possibly reach their level in the so-called “catch up effect.” An immense archipelago of “convergence literature” developed around this point, creating distinctions between sigma-convergence (σ-convergence) and beta-convergence (β-convergence), and between absolute beta-convergence and conditional beta-convergence.12 All of these tools were developed to bring the heart of the matter into focus: whether inequalities in income per capita13 or productivity between poor and wealthy nations were decreasing or not.
This means trying to discover the forces that can explain the differences in income per capita between the various countries and, correspondingly, in their long-term growth rates. Hence the choice of working on very large groups of countries, wealthy and poor, and the scarce attention paid to OECD countries and their specific natures.14 This body of literature was deeply influenced by theoretical growth models, and particularly by development economics and “endogenous growth” models.15 These studies, however, seem to take for granted the assumptions that growth is a potentially limitless process and that the mechanisms that govern it are universal, meaning they do not change much over time or space.16
In many ways, this book adopts the opposite perspective. In the following pages, I will focus only on advanced economies (the 34 OECD countries) during their latest growth cycle (1995-2007). I will not be looking for the general factors that determine economic growth; instead, I will be looking at advanced economies to ascertain what makes some of them grow while others lag behind. Finally, despite being enticed by the idea of limitless growth (and by the mathematical models describing it), I will not take it for granted. Do our societies still have a significant stretch of progress ahead, or are they about to recede instead into a regime of stagnation or even zero-growth? The answer to this question cannot be established arbitrarily based on certain theoretical or ideological considerations. It is something that deserves to be studied in depth, starting from the data concerning our recent history. This is what I intend to do in this book.
Indice dei contenuti
- Cover
- Title page
- The Growth Enygma
- Foreword. The future of growth
- Introduction
- 1. The decline in numbers
- 2. Economic growth theories: from Solow to Solow
- 3. Snails or gazelles: why?
- 4. The growth equation
- 5. The five driving forces of growth
- 6. The equation at work
- 7. Lilliput: the forces not driving growth
- 8. The dragon-whale: why wealth stifles growth
- 9. Optimists versus pessimists: the mathematics of economic growth
- 10. Forests, salmon, and predators
- 11. The Chapman-Richards equation
- 12. Back to Solow
- 13. The destiny of advanced economies
- 14. After 2007: between crisis and stagnation
- 15. A seigneurial drift
- What to do?
- DUCKS (appendices):
- Notes
- Bibliography
- Copyright
Domande frequenti
Sì, puoi annullare l'abbonamento in qualsiasi momento dalla sezione Abbonamento nelle impostazioni del tuo account sul sito web di Perlego. L'abbonamento rimarrà attivo fino alla fine del periodo di fatturazione in corso. Scopri come annullare l'abbonamento
No, i libri non possono essere scaricati come file esterni, ad esempio in formato PDF, per essere utilizzati al di fuori di Perlego. Tuttavia, puoi scaricarli nell'app Perlego per leggerli offline su smartphone o tablet. Scopri come scaricare libri offline
Perlego offre due piani: Essential e Complete
- Essential è l'ideale per chi studia o per i professionisti che amano esplorare una vasta gamma di argomenti. Accedi all'Essential Library con oltre 800.000 titoli affidabili e bestseller nei settori business, crescita personale e discipline umanistiche. Include tempo di lettura illimitato e voce standard per la funzione Leggi ad alta voce.
- Complete: perfetto per studenti avanzati e ricercatori che necessitano di accesso completo e senza restrizioni. Sblocca oltre 1,5 milioni di libri su centinaia di argomenti, inclusi titoli accademici e specialistici. Il piano Complete offre anche funzionalità avanzate come Leggi ad alta voce Premium e Assistente alla ricerca.
Perlego è un servizio di abbonamento a libri di testo online che ti permette di accedere a un'intera biblioteca digitale a meno del prezzo di un singolo libro al mese. Con oltre 1,5 milioni di libri su più di 990 argomenti, qui trovi tutto ciò che ti serve! Scopri la nostra missione
Cerca l'icona Sintesi vocale nel prossimo libro che leggerai per verificare se è possibile riprodurre l'audio. Questo strumento permette di leggere il testo a voce alta, evidenziandolo man mano che la lettura procede. Puoi aumentare o diminuire la velocità della sintesi vocale, oppure sospendere la riproduzione. Scopri di più sulla funzione di sintesi vocale
Sì! Puoi utilizzare l'app di Perlego su dispositivi iOS e Android per leggere quando e dove vuoi, anche offline. È perfetta per gli spostamenti quotidiani o quando sei in viaggio.
I dispositivi con iOS 13 e Android 7 o versioni precedenti non sono supportati. Scopri di più su come utilizzare l'app
I dispositivi con iOS 13 e Android 7 o versioni precedenti non sono supportati. Scopri di più su come utilizzare l'app
Sì, puoi accedere a The Growth Enigma di Luca Ricolfi in formato PDF e/o ePub, così come ad altri libri molto apprezzati su Economia e Politica economica. Abbiamo oltre 1,5 milioni di libri disponibili nel nostro catalogo da esplorare.