This book presents an introduction to structural equation modeling (SEM) and facilitates the access of students and researchers in various scientific fields to this powerful statistical tool. It offers a didactic initiation to SEM as well as to the open-source software, lavaan, and the rich and comprehensive technical features it offers. Structural Equation Modeling with lavaan thus helps the reader to gain autonomy in the use of SEM to test path models and dyadic models, perform confirmatory factor analyses and estimate more complex models such as general structural models with latent variables and latent growth models. SEM is approached both from the point of view of its process (i.e. the different stages of its use) and from the point of view of its product (i.e. the results it generates and their reading).
Domande frequenti
Come faccio ad annullare l'abbonamento?
È semplicissimo: basta accedere alla sezione Account nelle Impostazioni e cliccare su "Annulla abbonamento". Dopo la cancellazione, l'abbonamento rimarrà attivo per il periodo rimanente già pagato. Per maggiori informazioni, clicca qui
È possibile scaricare libri? Se sì, come?
Al momento è possibile scaricare tramite l'app tutti i nostri libri ePub mobile-friendly. Anche la maggior parte dei nostri PDF è scaricabile e stiamo lavorando per rendere disponibile quanto prima il download di tutti gli altri file. Per maggiori informazioni, clicca qui
Che differenza c'è tra i piani?
Entrambi i piani ti danno accesso illimitato alla libreria e a tutte le funzionalità di Perlego. Le uniche differenze sono il prezzo e il periodo di abbonamento: con il piano annuale risparmierai circa il 30% rispetto a 12 rate con quello mensile.
Cos'è Perlego?
Perlego è un servizio di abbonamento a testi accademici, che ti permette di accedere a un'intera libreria online a un prezzo inferiore rispetto a quello che pagheresti per acquistare un singolo libro al mese. Con oltre 1 milione di testi suddivisi in più di 1.000 categorie, troverai sicuramente ciò che fa per te! Per maggiori informazioni, clicca qui.
Perlego supporta la sintesi vocale?
Cerca l'icona Sintesi vocale nel prossimo libro che leggerai per verificare se è possibile riprodurre l'audio. Questo strumento permette di leggere il testo a voce alta, evidenziandolo man mano che la lettura procede. Puoi aumentare o diminuire la velocità della sintesi vocale, oppure sospendere la riproduzione. Per maggiori informazioni, clicca qui.
Structural Equation Modeling with lavaan è disponibile online in formato PDF/ePub?
Sì, puoi accedere a Structural Equation Modeling with lavaan di Kamel Gana, Guillaume Broc in formato PDF e/o ePub, così come ad altri libri molto apprezzati nelle sezioni relative a Mathematik e Wahrscheinlichkeitsrechnung & Statistiken. Scopri oltre 1 milione di libri disponibili nel nostro catalogo.
Structural Equation Modeling (SEM) is a comprehensive and flexible approach that consists of studying, in a hypothetical model, the relationships between variables, whether they are measured or latent, meaning not directly observable, like any psychological construct (for example, intelligence, satisfaction, hope, trust1). Comprehensive, because it is a multivariate analysis method that combines the inputs from factor analysis and that of methods based or derived from multiple regression analysis methods and canonical analysis [BAG 81, KNA 78]. Flexible, because it is a technique that allows not only to identify the direct and indirect effects between variables, but also to estimate the parameters of varied and complex models including latent variable means.
Mainly of a correlational nature, structural models are both linear statistical models, whose normal distribution of variables is almost necessary, and statistical models in the sense that the error terms are considered to be partly related to the endogenous variables (meaning predicted). We say almost necessary because the success of structural equation modeling is such that its application extends, certainly with risks of error, to data obtained through categorical variables (ordinal or even dichotomous) and/or by clearly violating the multivariate normal distribution. Considerable mathematical advances (like the so-called “robust” estimation methods) have helped currently minimize these risks by providing some remedies to the non-normality of the distribution of variables and the use of data collected by the means of measurement scales other than that normally required for structural equation models, namely interval scales [YUA 00]. We will discuss more on that later.
Our first goal is to introduce the reader to the use of structural equation models and understand their underlying logic; we will not delve too much into mathematical and technical details. Here, we will restrict ourselves to introducing, by way of a reminder, the concepts of correlation, multiple regression, and factor analysis, of which structural equation modeling is both a summary and a generalization. We will provide to the reader some details about the concept of normality of distribution, meaning with linearity, a basic postulate of structural equation modeling. The reader will find the mathematical details concerning the basic concepts briefly recalled here in any basic statistical manual.
1.1. Basic concepts
1.1.1.Covariance and bivariate correlation
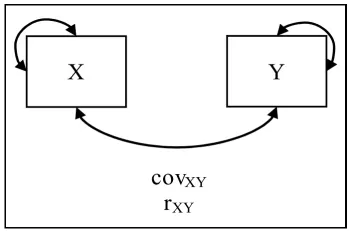
Both covariance and correlation measure the linear relationship between two variables. For example, they make it possible to learn about the relationship between two items of a test or a measure (e.g., a questionnaire) scale. Figure 1.1 provides a graphic illustration of the same.
Figure 1.1.Covariance/correlation between two variables (the small curved left-right arrow indicates the variance)
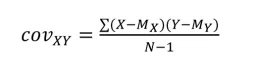
Covariance, which measures the variance of a variable with respect to another (covariance), is obtained as follows:
[1.1]
where:
– M = mean;
– N = sample size.
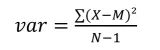
Being the dispersion around the mean, the variance is obtained as follows:
[1.2]
The values of a covariance have no limits. Only, it should be noted that the positive values of covariance indicate that values greater than the mean of a variable are associated with values greater than the mean of the other variable and the values lesser than the mean are associated in a similar way. Negative covariance values indicate values greater than the mean of a variable are associated with values lesser than the mean of the other variable.
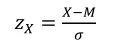
Unlike covariance, correlation measures such a relationship after changing the original units of measurement of variables. This change, called “standardization” or “normalization”, involves centering-reducing (i.e. M = 0.00, standard deviation = 1.00) a variable (X) by transforming its raw score into z score:
[1.3]
where:
– M = mean of X;
– σ = standard deviation of X.
The standard deviation is simply the square root of the variance:
[1.4]
Remember that standard deviation is the index of dispersion around the mean expressing the lesser or higher heterogeneity of the data. Although standard deviation may not give details about the value of scores, it is expressed in the same unit as these. Thus, if the distribution concerns age in years, the standard deviation will also be expressed in the number of y...