This monograph reviews all relevant technologies based on mass spectrometry that are used to study or screen biological interactions in general.
Arranged in three parts, the text begins by reviewing techniques nowadays almost considered classical, such as affinity chromatography and ultrafiltration, as well as the latest techniques. The second part focusses on all MS-based methods for the study of interactions of proteins with all classes of biomolecules. Besides pull down-based approaches, this section also emphasizes the use of ion mobility MS, capture-compound approaches, chemical proteomics and interactomics. The third and final part discusses other important technologies frequently employed in interaction studies, such as biosensors and microarrays.
For pharmaceutical, analytical, protein, environmental and biochemists, as well as those working in pharmaceutical and analytical laboratories.
eBook - ePub
Analyzing Biomolecular Interactions by Mass Spectrometry
- English
- ePUB (mobile friendly)
- Available on iOS & Android
eBook - ePub
Analyzing Biomolecular Interactions by Mass Spectrometry
About this book
Trusted by 375,005 students
Access to over 1.5 million titles for a fair monthly price.
Study more efficiently using our study tools.
Information
1
Introduction to Mass Spectrometry, a Tutorial
Wilfried M.A. Niessen and David Falck
1.1 Introduction
In the past 30 years, mass spectrometry (MS) has undergone a spectacular development, in terms of both its technological innovation and its extent of application. On-line liquid chromatography–mass spectrometry (LC–MS) has become a routine analytical tool, important in many application areas. The introduction of electrospray ionization (ESI) and matrix-assisted laser desorption/ionization (MALDI) has enabled the MS analysis of highly polar and large molecules, including biomacromolecules. MS is based on the generation of gas-phase analyte ions, the separation of these ions according to their mass-to-charge ratio (m/z), and the detection of these ions. A wide variety of ionization techniques are available to generate analyte ions (Section 1.3). Mass analysis can be performed by six types of mass analyzers (Section 1.4), although quite frequently tandem mass spectrometers, featuring the combination of two mass analyzers, are used (Section 1.5). The data acquired by MS allow quantitative analysis of target analytes, determination of the molecular mass/weight, and/or structure elucidation or sequence determination of (unknown) analytes (Section 1.6).
This chapter provides a general introduction to MS, mainly from a functional point of view. Next to basic understanding of operating principles of ionization techniques and mass analyzers, the focus is on data interpretation and analytical strategies required in the study of biomolecular interactions using MS.
1.2 Figures of Merit
1.2.1 Introduction
An MS experiment typically consists of five steps: (i) sample introduction, (ii) analyte ionization, (iii) mass analysis, (iv) ion detection, and (v) data processing and interpretation of the results. Sample introduction may involve individual samples or may follow (on-line) chromatographic separation. Mass analysis and ion detection require a high vacuum (pressure ≤ 10−5 mbar). Analyte ionization may take place either in high vacuum or at atmospheric pressure. In the latter case, a vacuum interface is required to transfer ions from the atmospheric-pressure ionization (API) source into the high-vacuum mass analyzer region.
In its basic operation with on-line chromatography or other forms of continuous sample introduction, the mass spectrometer continuously acquires mass spectra, that is, the instrument is operated in the full-spectrum (or full-scan) mode. This means that a three-dimensional data array is acquired, defined by three axes: time, m/z, and ion intensity (counts). This data array can be visualized in different ways (Figure 1.1). In the total-ion chromatogram (TIC), the sum of the ion counts in the individual mass spectra are plotted as a function of time. A mass spectrum represents a slice of the data array of the ion counts as a function of m/z at a particular time point. Summed, averaged, and/or background subtracted mass spectra can be generated. Mass spectra may be searched against libraries, when available, to assist in compound identification. In an extracted-ion chromatogram (XIC), the counts for the ion with a selected m/z are plotted as a function of time. The m/z selection window may be adapted to the resolution of the mass spectrometer. In instruments providing unit-mass resolution, the selection window in most cases is ±0.5 m/z units (u), whereas with high-resolution mass spectrometry (HRMS, see below) selection windows as small as ±10 mu can be used (narrow-window XIC). In a base-peak chromatogram (BPC), the ion count recorded for the most abundant ion in each spectrum is plotted as a function of time. BPCs are especially useful for peak searching in chromatograms with relatively high chemical background. More advanced tools of data processing are discussed in Section 1.6.1.
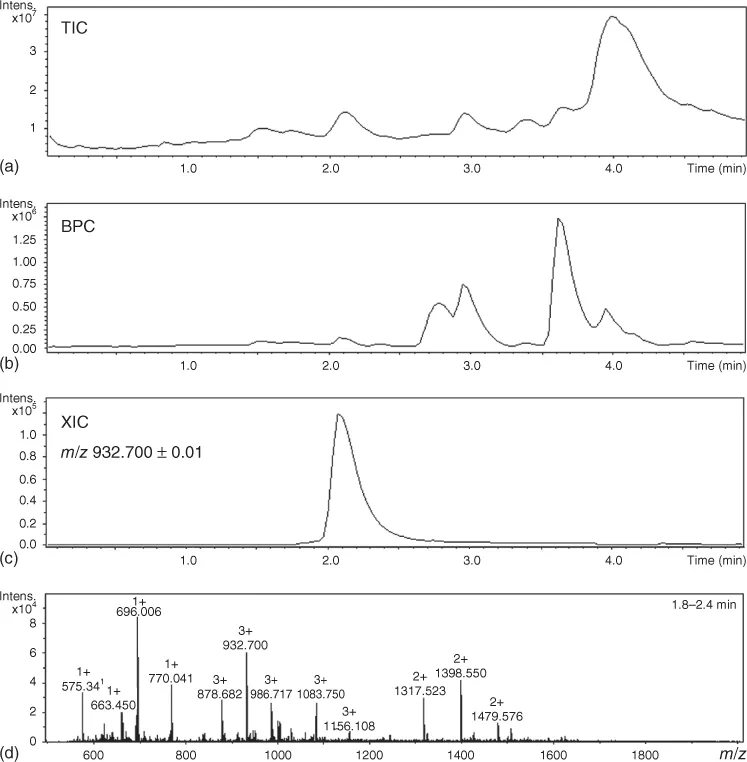
Figure 1.1 Visualization of the three-dimensional data array acquired in a full-spectrum MS experiment. (a) Total-ion chromatogram (TIC), (b) base-peak chromatogram (BPC), (c) extracted-ion chromatogram (XIC), and (d) mass spectrum. Data for an N-glycopeptide from the LC–MS analysis of a tryptic digest of a commercial immunoglobulin G (IgG) standard, analyzed using a Dionex Ultimate 3000 nano-LC coupled via ESI to a Bruker Maxis Impact Q-TOF MS in the laboratory of one of the authors (D. Falck).
Three figures of merit are relevant: mass spectrometric resolution, mass accuracy, and the acquisition speed, that is, the time needed to acquire one spectrum (or one data point in a chromatogram).
1.2.2 Resolution
Despite the fact that mass spectrometrists readily discuss (and boast) on the resolution of their instruments, it seems that there is no unambiguous definition available. The IUPAC (International Union of Pure and Applied Chemistry) recommendations [1] and ASMS (American Society for Mass Spectrometry) guidelines [2] are different in that respect [3, 4]. Most people in the MS community define resolution as m/Δm, where m is the mass of the ion (and obviously should be read as m/z) and Δm is either the peak width (mostly measured at full-width half-maximum, FWHM) or the spacing between two equal-intensity peaks with a valley of, for instance, 10% [1]. The FWHM definition is generally used with all instruments, except sector instruments where the valley definition is used. The resolving power is defined as the ability to distinguish two ions with a small difference in m/z However, resolving power has also been defined as m/Δm and the resolution as the inverse of resolving power [3]. The IUPAC definition is used throughout this text.
In a simple and straightforward way, mass analyzers can be classified as either unit-mass-resolution or high-resolution instruments (see Table 1.1). For unit-mass-resolution instruments such as quadrupoles and ion traps, calculation of the resolution as m/Δm is not very useful, as the FWHM is virtually constant over the entire mass range.
Table 1.1 Characteristics and features of different mass analyzers
| Analyzer | Resolutiona | Mass accuracy | Full-spectrum performanceb | Selected-ion performanceb | Pressure (mbar) |
| Quadrupole | Unit-mass | ±0.1 | + | ++ | <10−5 |
| Ion-trap | Unit-mass | ±0.1 | ++ | + | 10−5 |
| Time-of-flight | ≤70 000 | <3 ppm | ++ | − | <10−7 |
| Orbitrap | ≤140 000 | <1 ppm | ++ | − | <10−9 |
| FT-ICR | ≤400 000 | <1 ppm | ++ | − | <10−9 |
| Sector | ≤60 000 | <3 ppm | + | ++ | <10−7 |
a Resolution based on FWHM definition, except for sector (5% valley definition).
b ++, instrument highly suitable for this operation; +, instrument less suitable for this operation; and −, instrument not suitable for this operation (post-acquisition XIC possible).
1.2.3 Mass Accuracy
In MS, the mass of a molecule or the m/z of an ion is generally expressed as a monoisotopic mass (molecular mass) or m/z, referring to the masses of the most abundant natural isotopes of the elements present in the ion or molecule. In chemistry, the average mass or molecular weight is used, based on the average atomic masses of the elements present in the molecule. The exact mass (or better m/z) of an ion is its calculated mass, that is, its theoretical mass. In this respect, the charge state of the ion is relevant, because the electron mass (0.55 mDa) may not be negligible. The accurate mass (or better m/z) of an ion is its experimentally determined mass, measured with an ap...
Table of contents
- Cover
- Related Titles
- Title Page
- Copyright
- List of Contributors
- Preface
- Abbreviations
- Chapter 1: Introduction to Mass Spectrometry, a Tutorial
- Part I: Direct MS Based Affinity Techniques
- Part II: LC-MS Based with Indirect Assays
- Part III: Direct Pre- and On-Column Coupled Techniques
- Part IV: Direct Post Column Coupled Affinity Techniques
- Index
- End User License Agreement
Frequently asked questions
Yes, you can cancel anytime from the Subscription tab in your account settings on the Perlego website. Your subscription will stay active until the end of your current billing period. Learn how to cancel your subscription
No, books cannot be downloaded as external files, such as PDFs, for use outside of Perlego. However, you can download books within the Perlego app for offline reading on mobile or tablet. Learn how to download books offline
Perlego offers two plans: Essential and Complete
- Essential is ideal for learners and professionals who enjoy exploring a wide range of subjects. Access the Essential Library with 800,000+ trusted titles and best-sellers across business, personal growth, and the humanities. Includes unlimited reading time and Standard Read Aloud voice.
- Complete: Perfect for advanced learners and researchers needing full, unrestricted access. Unlock 1.5M+ books across hundreds of subjects, including academic and specialized titles. The Complete Plan also includes advanced features like Premium Read Aloud and Research Assistant.
We are an online textbook subscription service, where you can get access to an entire online library for less than the price of a single book per month. With over 1.5 million books across 990+ topics, we’ve got you covered! Learn about our mission
Look out for the read-aloud symbol on your next book to see if you can listen to it. The read-aloud tool reads text aloud for you, highlighting the text as it is being read. You can pause it, speed it up and slow it down. Learn more about Read Aloud
Yes! You can use the Perlego app on both iOS and Android devices to read anytime, anywhere — even offline. Perfect for commutes or when you’re on the go.
Please note we cannot support devices running on iOS 13 and Android 7 or earlier. Learn more about using the app
Please note we cannot support devices running on iOS 13 and Android 7 or earlier. Learn more about using the app
Yes, you can access Analyzing Biomolecular Interactions by Mass Spectrometry by Jeroen Kool, Wilfried M. A. Niessen, Jeroen Kool,Wilfried M. A. Niessen in PDF and/or ePUB format, as well as other popular books in Physical Sciences & Industrial & Technical Chemistry. We have over 1.5 million books available in our catalogue for you to explore.