![]()
Chapter 1
Colorimetry and Physiology – The LMS Specification 1
To test and improve the quality of color images, we need to know how the human visual system operates. Colorimetry is a method that quantitatively assesses the changes that the engineer makes to an image. Recent advances in this field are due to a better understanding of visual mechanisms.
This chapter first describes the physiological mechanisms that are transferred from the retina in the eye to the human brain, which produce the physiological perception of color. Then it presents two approaches to colorimetry: first, as recommended by the International Commission on Illumination (CIE), and second, deriving directly from the physiology of the visual system that results in the ability to specify stimuli and color differences. Finally, the chapter outlines the difficulties in defining the appearance of color and the advantages in modeling the human visual system.
1.1. Physiological basis
Light detected by the eye excites the photoreceptors that are photosensitive cells. It produces biochemical changes and yields a signal, which is relayed by different classes of post-synaptic retinal neurons. The post-synaptic retinal neurons are organized in a layer in radial and transversal directions. The information is conveyed along the radial direction of the receptors toward the bipolar cells and then toward the ganglion cells whose axons form the optic nerve.
Horizontal cells and amacrine cells form a transversal network, whose action modulates direct signals. Then, the signal travels in the form of trains of action potentials through the optic nerve toward the visual cortex, where a visual image is formed.
1.1.1. The photoreceptors
1.1.1.1. Spectral sensitivity of cones, the monovariant response of a photoreceptor
Each photon absorbed by a cone triggers a cascade of chemical reactions producing a signal at the output of the cone, regardless of the wavelength associated with that photon. As a result, the amplitude of the response of the cone to light depends only on the number of absorbed photons, and not on the wavelength associated with the photons. While light consist of wavelengths in the visible spectrum with wide energy distributions, the response of a single cone is monovariant, it varies only in amplitude. If the photon has energy close to that required for the isomerization of the photosensitive pigment included in the cone, this is absorbed by the cone. The probability of absorption is determined by the spectral sensitivity of the cone.
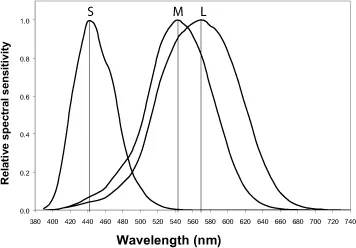
The in vitro measurements of the spectral sensitivity of the cones [DAR 83] showed the existence of three families of retinal cones with maxima at 419, 531 and 558 nm. This would correspond to in vivo measurements in a healthy eye, taking into account the filtering effect of the ocular media, which is about 440 nm for S cones sensitive to short wavelengths, 540 nm for M cones, sensitive to middle wavelengths,
and 565 nm for L cones, sensitive to longer wavelengths. The spectral sensitivity curves are widely spread over the visible spectrum, with the M and L cones being close to each other. It should be noted that there is no retinal cone whose maximum sensitivity lies in the part of the spectrum that appears red to the eye (beyond about 620 nm), indicating that the retinal cones are not simple color receptors. Red, like other colors, is reconstructed by the visual system. The M and L cones give to the eye its maximum light sensitivity of around 555 nm.
1.1.1.2. The retinal mosaic
Through optical or electronic microscopy, it is observed that the retina consists of two types of morphologically distinct photoreceptors: rods and cones. Rods are responsible for the vision at low illumination, and conesathigher illumination. The numerical densityof conesismaximum in the fovea, that is to say in the central area of the retina, where images of the objects that we see are formed, and drops significantly toward the surrounding area. It is also possible to observe the cones in vivo, or at the back of the eye, using adaptive optics that neutralize the aberrations. We can also identify their corresponding families L, M or S [ROO 99, HOF 05]. Among the ten retinas that were examined, it was verified that the S cones were relatively few and that the numerical proportion of L and M cones was on average 2L for 1M, with surprising variations from person to person ranging from 1L for 2M to 16L for 1M, for normal color vision.
1.1.2. Retinal organization
The extraction of the color signal is achieved by comparing the signals from a family of cones with those from another family of cones. This comparison is carried out by post-synaptic retinal neurons.
1.1.2.1. Concept of receptive field of the neuron
Each neuron of the visual system, wherever it is located in the hierarchy of the processing, corresponds to a given area of space seen by the subject. It also corresponds to all the requested photoreceptors, within which the bio-electrical behavior of the neuron is changed. This area is called the receptive field of the neuron.
The receptive fields are small in the fovea, and larger as we move away from it. Each neuron is only a small, circular part of the visual field and the encoding of the signal responsible for each neuron depends on its immediate environment.
A retinal neuron does not perform an absolute coding of the light contained in its receptive field, but a coding related to the light status in the near vicinity. Only a differential signal (contrast) generates a signal in the neuron, which is transmitted to the next neurones in the hierarchy of visual information processing. The contrast may relate both to a difference in light or to a difference in spectral content of light.
1.1.2.2. Two parallel pathways from the retina to the cortex
The chemical contact between photoreceptors, bipolar cells, and horizontal cells is carried out at the terminal portion of the cone and is called “synapse”. The synapse type determines a fundamental functional dichotomy of the coding of the light signal. Some bipolar cells have synapses that maintain the polarity of the signal coming from the cone, others reverse it. The ON-bipolar cells indicate an increment of light at the center of the receptive field (relative to the surrounding fields). They initiate a neural pathway called the ON pathway. The OFF-bipolar cells indicate a decrease in light at the center of the receptive field (relative to the surrounding fields). They initiate a neural pathway called the OFF pathway. These ON and OFF pathways run in parallel across each unit area of the visual space by encoding all the variations of light and remain independent up to the cortex.
1.1.2.3. At the origin of konio, parvo and magnocellular pathways
Different types of bipolar cells are at the origin of three separate neurophysiological pathways from the retina to the cortex: the koniocellular pathway dedicated to spectral differentiation; the parvocellular pathway dedicated to spectral differentiation and light differentiation; and the magnocellular pathway dedicated to light differentiation.
Midget bipolar (MB) cells are the most numerous. They receive signals from cones L and M. They are distinguished by the type of synapse, one belonging to the ON pathway, others to the OFF pathway (see next section).
For ease of nomenclature, a neuron whose receptive field center is ON (responding to an increase in light), will be encoded by “+”, and a neuron whose receptive field center is OFF (responding to a decrease in light) will be encoded “−”. The letter follow...