Key Features:
• A specific focus on management applications in a period of increasing demands on managers to characterize river features and their evolution at different spatial scales
• An integration across all scales of imagery with a clear discussion of both ground based and airborne images
• Includes a wide-range of environmental problems
• Coverage of cutting-edge technology
• Contributions from leading researchers in the field
eBook - ePub
Fluvial Remote Sensing for Science and Management
- English
- ePUB (mobile friendly)
- Available on iOS & Android
eBook - ePub
Fluvial Remote Sensing for Science and Management
About this book
This book offers a comprehensive overview of progress in the general area of fluvial remote sensing with a specific focus on its potential contribution to river management. The book highlights a range of challenging issues by considering a range of spatial and temporal scales with perspectives from a variety of disciplines. The book starts with an overview of the technical progress leading to new management applications for a range of field contexts and spatial scales. Topics include colour imagery, multi-spectral and hyper-spectral imagery, video, photogrammetry and LiDAR. The book then discusses management applications such as targeted, network scale, planning, land-use change modelling at catchment scales, characterisation of channel reaches (riparian vegetation, geomorphic features) in both spatial and temporal dimensions, fish habitat assessment, flow measurement, monitoring river restoration and maintenance and, the appraisal of human perceptions of riverscapes.
Trusted by 375,005 students
Access to over 1.5 million titles for a fair monthly price.
Study more efficiently using our study tools.
Information
Chapter 1
Introduction: The Growing Use of Imagery in Fundamental and Applied River Sciences
1.1 Introduction
Earth observation now plays a pivotal role in many aspects of our lives. Indeed, hardly a day goes by without some part of our lives relying on some form of remote sensing. Weather predictions, mapping and high level scientific applications all make intensive use of imagery acquired from satellites, aircraft or ground-based remote sensing platforms. This form of data acquisition which relies on the reflection or emission of radiation on a target surface is now well accepted as a standard approach to data acquisition. However, the fields of river sciences and remote sensing have operated independently during much of their respective histories. Indeed remote sensing practitioners generally consider streams as linear, or perhaps network, entities in the landscape. In contrast, river scientists such as fluvial geomorphologists, lotic and riparian ecologists, with their focus on the internal structure of rivers and the processes which create these structures, often have a much more localised but three dimensional view of river systems. Nevertheless, both modern fluvial geomorphology and ecology are increasingly recognising that we need to reconcile these viewpoints. In a seminal paper, Fausch et al. (2002) discuss the scientific basis for this reconciliation. These authors argue that natural processes, both biotic and abiotic, frequently operate on larger spatial scales and longer time scales than traditional river sciences and management. Consequently, the authors argue that localised, non-continuous, sampling of small scale river processes, forms and biota leads to a fundamental scale mismatch between the processes under scrutiny and our data collection. Fausch et al. (2002) therefore argue that river sciences and management must begin to consider and sample river catchments (i.e. watersheds) at larger scales and that these units must be considered more explicitly as holistic system.
The need to study and sample river catchments as holistic systems naturally leads to the use of remote sensing as a basic methodology. Remotely sensed data and imagery is indeed the only approach which could conceivably give continuous data over entire catchments (Mertes, 2002; Fonstad and Marcus, 2010). However, in the 1990s and early 2000s, existing remote sensing acquisition hardware and analysis methods were neither tailored nor very suitable to the needs and interests of river scientists and managers. Mertes (2002) presented a review of remote sensing in riverine environments at the turn of the century. At that time, any data with sub-metric spatial resolution was considered of ‘microhabitat’ scale. Consequently, riverine features identified by remote sensing in the late twentieth century were generally of hectametric or kilometric scales. However, developments in the early twentieth century proceeded at a rapid pace and our ability to resolve fine details in the landscape has dramatically improved in the last decade (see Chapter 8 and Marcus and Fonstad (2008) for a comprehensive review). Therefore, publications on the remote sensing of rivers have dramatically increased and ‘Fluvial Remote Sensing’ (FRS) is emerging as a self-contained sub-discipline of remote sensing and river sciences (Marcus and Fonstad, 2010). Moreover, the technical progress accomplished in the past two decades of research in FRS means that this sub-discipline of remote sensing has now begun to make real contributions to river sciences and management and the appearance of a volume on the topic is therefore timely. Our aim with this edited volume is to give readers with a minimal background in remote sensing a concise text that will cover the broadest possible range of potential applications of Fluvial Remote Sensing and provide contrasted examples to illustrate the capabilities and the variety of techniques and issues. Readers will notice when consulting the table of contents that we take a very broad view of ‘remote sensing’. In addition to more conventional remote sensing approaches such as satellite imagery, air photography and laser scanning, the volume includes a wider range of applications where image and/or video data is applied to support river science and management. This chapter will set the context of this volume by first giving a very brief introduction to remote sensing and by discussing the evolution of journal publications in fluvial remote sensing approaches and river management. Finally, we will give a brief outline of the volume.
1.2 Remote sensing, river sciences and management
1.2.1 Key concepts in remote sensing
Here we will introduce some key remote sensing concepts which will help us illustrate and contextualise fluvial remote sensing as a sub-discipline. However, this introduction is not meant as a foundation text in remote sensing and we refer the reader in need of some fundamental material to classic remote sensing textbooks such as Lillesand et al. (2008) or Chuvieco and Alfredo (2010).
Remote sensing has a multitude of definitions. In broad terms, ‘remote sensing may be formally defined as the acquisition of information about the state and condition of an object through sensors that are not in physical contact with it’ (Chuvieco and Alfredo, 2010). This type of broad definition does not place any restriction on the type of interactions that occur between the target and the sensor. According to this definition, echo-sounding devices such as sonar which use acoustic energy in order to detect objects in a fluid media such as air or water should be considered as remote sensing. However it should be noted that references to remote sensing usually apply to the collection of information via electromagnetic energy such as visible light, infrared light, active laser pulses, etc. Remote sensing is then generally divided in two broad categories: active or passive remote sensing. This description refers to the source of radiation. Passive remote sensing relies on externally emitted sources of radiation whilst active remote sensing relies on internally generated and emitted radiation. The best-known example of active remote sensing is RADAR (Radio Detection And Ranging) which uses radio waves to establish the position of objects in the vicinity of the sensor. More recently, lasers have been used in active remote sensing to give birth to LiDAR (Light Detection And Ranging) technology. LiDAR technology is rapidly becoming the method of choice for the generation of topography from ground based and airborne platforms and is the focus of Chapters 7 and 14 of this volume.
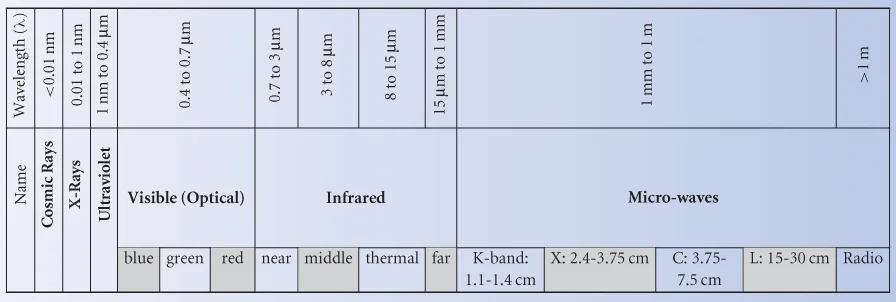
The key parameter exploited by active remote sensing has always been the time elapsed between the emission of a radiation pulse and it's detected return. As a result, active remote sensing uses a narrow and finite portion of the electromagnetic spectrum. For example, typical LiDAR technology uses infrared lasers with a wavelength of 1024 nm and radar relies on radio waves with wavelengths of 1–10 cm. Passive sensors, which rely on an external source of radiation (usually the sun), make a much more comprehensive usage of the electromagnetic spectrum. This is the type of remote sensing which is familiar to all of us because our visual system uses solar radiation to detect features in our surroundings. Table 1.1 presents a simplified form of the electromagnetic spectrum. This table gives the common names and categories of radiation as we move, from left to right, from the very short wavelengths of high energy cosmic radiation to the very long wavelengths of lower energy micro-waves and radio waves. Generally speaking, the majority of passive remote sensing sensor devices applied to earth observation uses radiation in the visible and infrared portions of Table 1.1. Given that the electromagnetic spectrum has a continuous range of frequencies (i.e. radiation wavelength is not intrinsically discreet), their detection and quantification relies on sensors that can detect incident radiation within a specified, finite, range of wavelengths. The most basic example of this would be greyscale (black and white) imagery where the brightness of a point on the photograph is proportional to the total amount of visible radiation, with frequencies ranging from approximately 0.4 to 0.7 microns, received by the sensor (e.g. the camera film). A further example would be standard colour photography. In this case, it would clearly be impossible to have a near infinite number of detectors each sensitive to a specific wavelength in the continuous visible spectrum. The solution which was therefore adopted in the early days of colour photography was to emulate human vision and to re-create colour by first sampling radiation in three distinct areas of the spectrum: red, green and blue (Lillesand et al., 2008). Within each of these primary colour bands, the total amount of radiation incident upon the sensor is recorded. Therefore for the red band, the sensor detects all the radiation with frequencies between approximately 0.6 and 0.7 microns. For the green band the sensor detects all the radiation from approximately 0.5 and 0.6 microns and for the blue band, detectable wavelengths range from 0.4 to 0.5 microns. It should be noted that the term ‘band’ mentioned earlier is one of the most fundamental in the remote sensing vocabulary. Formally, a ‘spectral band’ is a finite section of the electromagnetic spectrum, recorded and stored in a raster data layer. In the examples above, a greyscale image is a one band image and a colour image is a three band image. The term ‘multispectral’ therefore refers to a remote sensing approach or dataset which has several bands. Strictly speaking, colour photography, with its three bands in red, green and blue, can be considered as multispectral imagery. However, many authors and practitioners reserve the term ‘multispectral’ for datasets which have at least four spectral bands with one of the bands usually covering the infrared portion of the spectrum. It should be noted that the number of available bands is not the only important characteristic of a remotely sensed image. Potential applications of remotely sensed data are often limited and one might even say, defined, by four additional parameters: spectral resolution, spatial resolution, temporal resolution and, to a lesser extent, radiometric resolution.
Table 1.1 Simplified Electromagnetic Spectrum table (Modified from Ward et al., 2002).
The concept of spectral resolution is closely related to the concept of a spectral band. It relates to the width, expressed in linear units of radiation wavelength (nm or μm), of the spectral bands of the imaging device. A clear distinction must therefore be made between the number of bands measured by a sensor which determines the range of radiation wavelengths that is sampled and the width (or narrowness) of an individual band which determines the sensors sensitivity to specific spectral features. Arguably the most classic example of the use of spectral features in remote sensing is the detection of vegetation. In healthy green vegetation, chlorophyll absorbs over 90% of incident radiation within the visible spectrum, albeit with a slightly lesser absorption and higher reflection in green wavelengths, which explains the colour of vegetation. However, in the infrared wavelengths, vegetation is a strong reflector. Sensors designed to detect vegetation, such as the classic Thematic Mapper sensor mounted on Landsat satellites, therefore try to exploit these differences by sampling red light (0.63–0.69 μm) which is strongly absorbed by vegetation and near infrared light (0.76–0.90 μm) which is strongly reflected. Note the relatively narrow width, in spectral terms of these bands. Our ability to accurately detect vegetation from remote sensing therefore depends not only on increasing the number of bands beyond the visible spectrum, but also on an improvement of the spectral resolution. If we follow this line of thought to its logical conclusion, we realise that it would be desirable to produce a sensor with a very high number of bands each with a very narrow bandwidth. Such sensors are called ‘Hyperspectral’ and can have hundreds or even thousands of bands with resolutions as small as 0.002 μm. Whilst such hyperspectral sensors have huge potential, their usage in river sciences has been relatively limited and most of the progress in fluvial remote sensing rests on standard colour imagery with the conventional three bands of Red, Green and Blue (hence the term RGB imagery) which equates to a relatively coarse spectral resolution of approximately 0.2 μm.
One key advantage of widely available colour imagery is its very high spatial resolution. One of the most fundamental descriptors of remote sensing data, spatial resolution refers to the ground footprint of a single image pixel on real ground. This distance is generally quoted as a linear unit with the underlying assumption that the pixels are square. The spatial resolution of a dataset will define the smallest object that can be identified. Whilst there is no absolute rule for the number of pixels required to define a simple object (e.g. a boulder), our experience has shown that a minimum of 5X5 pixels are required in order to get an approximation of the object shape whilst 3X3, or even 2X2, pixels are required to establish to presence of an object of undefined shape in the image.
In parallel with spatial resolution, temporal resolution refers to the elapsed time between repeated imagery. Repeated image sampling has been somewhat less exploited in fluvial remote sensing. While studies of large rivers based on satellite imagery have been able to exploit the regular revisit frequency of orbital sensors (Sun et al., 2009; Frankl et al., 2011), airborne data is not acquired with the same regularity and studies reporting change based on airborne data are much less frequent. As a result, substantial progress remains to be made in terms of monitoring rivers and examining changes occurring at the smaller spatial resolutions that can be detected with airborne remote sensing. However, repeated imagery, including video imagery, has been successfully used at smaller scales for laboratory studies (see Chapter 13) and reach based studies (see Chapters 15 and 16). Furthermore, a largely un-exploited archive or terrestrial and airborne archival imagery exists for many parts of the world which does indeed include riverine areas. If issues such as image georeferencing (spatial positioning of the imagery), and image quality can be addressed (see Chapter 8), then these images could provide a very important source of data sometimes dating as far back as the nineteenth century.
The final parameter, radiometric resolution is easily confused with spectral resolution. Here the term ‘...
Table of contents
- Cover
- Title Page
- Copyright
- Series Foreword
- Foreword
- List of Contributors
- Chapter 1: Introduction: The Growing Use of Imagery in Fundamental and Applied River Sciences
- Chapter 2: Management Applications of Optical Remote Sensing in the Active River Channel
- Chapter 3: An Introduction to the Physical Basis for Deriving River Information by Optical Remote Sensing
- Chapter 4: Hyperspectral Imagery in Fluvial Environments
- Chapter 5: Thermal Infrared Remote Sensing of Water Temperature in Riverine Landscapes
- Chapter 6: The Use of Radar Imagery in Riverine Flood Inundation Studies
- Chapter 7: Airborne LiDAR Methods Applied to Riverine Environments
- Chapter 8: Hyperspatial Imagery in Riverine Environments
- Chapter 9: Geosalar: Innovative Remote Sensing Methods for Spatially Continuous Mapping of Fluvial Habitat at Riverscape Scale
- Chapter 10: Image Utilisation for the Study and Management of Riparian Vegetation: Overview and Applications
- Chapter 11: Biophysical Characterisation of Fluvial Corridors at Reach to Network Scales
- Chapter 12: The Role of Remotely Sensed Data in Future Scenario Analyses at a Regional Scale
- Chapter 13: The Use of Imagery in Laboratory Experiments
- Chapter 14: Ground based LiDAR and its Application to the Characterisation of Fluvial Forms
- Chapter 15: Applications of Close-range Imagery in River Research
- Chapter 16: River Monitoring with Ground-based Videography
- Chapter 17: Imagery at the Organismic Level: From Body Shape Descriptions to Micro-scale Analyses
- Chapter 18: Ground Imagery and Environmental Perception: Using Photo-questionnaires to Evaluate River Management Strategies
- Chapter 19: Future Prospects and Challenges for River Scientists and Managers
- Index
Frequently asked questions
Yes, you can cancel anytime from the Subscription tab in your account settings on the Perlego website. Your subscription will stay active until the end of your current billing period. Learn how to cancel your subscription
No, books cannot be downloaded as external files, such as PDFs, for use outside of Perlego. However, you can download books within the Perlego app for offline reading on mobile or tablet. Learn how to download books offline
Perlego offers two plans: Essential and Complete
- Essential is ideal for learners and professionals who enjoy exploring a wide range of subjects. Access the Essential Library with 800,000+ trusted titles and best-sellers across business, personal growth, and the humanities. Includes unlimited reading time and Standard Read Aloud voice.
- Complete: Perfect for advanced learners and researchers needing full, unrestricted access. Unlock 1.5M+ books across hundreds of subjects, including academic and specialized titles. The Complete Plan also includes advanced features like Premium Read Aloud and Research Assistant.
We are an online textbook subscription service, where you can get access to an entire online library for less than the price of a single book per month. With over 1.5 million books across 990+ topics, we’ve got you covered! Learn about our mission
Look out for the read-aloud symbol on your next book to see if you can listen to it. The read-aloud tool reads text aloud for you, highlighting the text as it is being read. You can pause it, speed it up and slow it down. Learn more about Read Aloud
Yes! You can use the Perlego app on both iOS and Android devices to read anytime, anywhere — even offline. Perfect for commutes or when you’re on the go.
Please note we cannot support devices running on iOS 13 and Android 7 or earlier. Learn more about using the app
Please note we cannot support devices running on iOS 13 and Android 7 or earlier. Learn more about using the app
Yes, you can access Fluvial Remote Sensing for Science and Management by Patrice Carbonneau, Hervé Piégay, Patrice Carbonneau,Hervé Piégay in PDF and/or ePUB format, as well as other popular books in Technology & Engineering & Civil Engineering. We have over 1.5 million books available in our catalogue for you to explore.