![]() 2011
2011![]()
Be Long Term but Watch the Ticks
As the year began, little did I know the horrors that awaited me in 2011. But first there was some good money to be made.
January 3, 2011
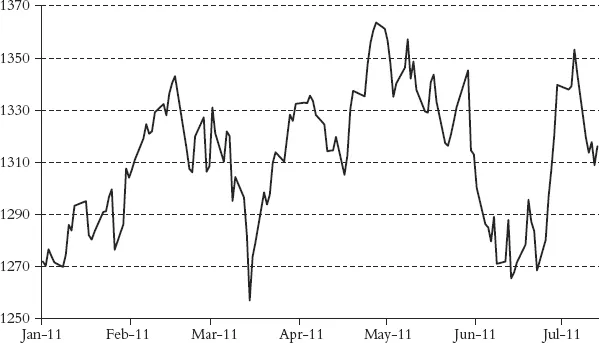
This time of year there is always the ridiculous obsession over forecasts of where markets will be a year from now. Mr. Market is smart and sadistic, and he couldn’t care less about our calendar. In other words, I have no idea. My sense is, however, that equities are going to work higher in the next couple of months.
As I go into 2011, I’m suffering from a mild case of acrophobia. I’ve been riding this rally since last summer with a very high net long, and markets have had a pleasant, gradual melt-up that has surprised a lot of people. In the U.S., big caps have risen 20% and the smalls are up 30%. Europe and the emerging markets have had roughly similar moves. The question now is whether I should reduce my net long substantially, say to 50 or 60%, and lie in the reeds for a while. As I circulate around, I find that the so-called “smart money” is uneasy and is currently taking off or has already taken off a substantial amount of risk. The prime broker summaries show that, particularly in the last two or three weeks, there has been substantial hedge fund selling of longs and shorts.
“Stocks are clearly overbought,” my co-conspirators say. “Bulls make money. Bears make money, but pigs get slaughtered.” The bears who didn’t participate in the rally are licking their wounds and are reluctant to get involved now for fear of the ignominy of a whip-saw. The pain trade for the consensus would be a further advance early in 2011. I’ve decided I’m going to hang in there for the time being in anticipation of a further move up in equities in the early part of the year. But I’ve got nervous feet.
Since we profess to be contrarians, we have done considerable research on sentiment, and on a weekly basis we construct an inclusive sentiment composite that consists of over 20 different indicators. By our measures, sentiment has become considerably more bullish but is not at an extreme. We have found that extremes of bearishness are very valuable timing signals. By contrast, excessive bullishness can persist for a long time without a downward market response. Keynes was right when he famously said that “the market can remain irrational longer than you can remain solvent.”
I’m staying invested because the economic news in the U.S.—and for that matter globally—continues to improve. In America, the combination of consumer animal spirits, quantitative easing, extension of the Bush tax cuts, and payroll tax reductions is causing consumer spending, business investment, and job creation to surge. Real GDP growth may reach 4% this year. Regional manufacturing PMIs, First Call earnings revisions, jobless claims, automobile sales, ECRI, and pending house sales all have turned positive. The high-frequency data from the emerging markets, including China, are picking up, and the J.P. Morgan global PMI is rising again. As Morgan puts it: “The drag on global manufacturing is fading.” Worldwide, the service sector is returning to life, and consumer and business confidence is rising. Morgan now anticipates that 2011 global growth will be at 3.7%, or 4.5% on a purchasing-power parity basis.
I’m also fairly convinced that there’s a big asset-allocation trade brewing for both individuals and institutions out of fixed income and into equities. The mutual fund investor in the U.S. has reacted as he always does. He doesn’t sell equities at the bottom; instead he redeems after the first big rally, which is what has been happening for the last 15 months. Institutions follow a similar path. Equity ratios are at record lows, and alternative assets such as private equity, venture capital, real estate, and yes, hedge funds, have been generally uninspiring. The return on cash and short-term paper is almost invisible. We’ve just finished the worst decade in real terms for equities in modern times, and bonds have done much better for the last 20 years. I believe in reversion to the mean: 6% to 7% real for equities and around 2.5% for 10-year government bonds.
The other big decision is: What are the markets and sectors we should emphasize? I think it’s the U.S. and the emerging markets. The European bourses are cheap on valuations, but the Euroland economy still is struggling with its sovereign debt issue and its very serious structural imbalances. The high-frequency data suggest 1.5% real growth (with some possibility of upside) and wide intra-regional variances. Germany is the powerhouse, the soft core of France and Italy stagnates, and the PIGS remain troubled and sickly for at least another year. There is no compelling reason to be involved.
Emerging market (EM) equities have lagged the S&P over the last couple of months because growth and inflation in many of them, particularly in Asia, seem too hot to handle, and as a result their central banks are reacting by raising official interest rates. Thus the near-term ride may be a bit bumpy. This has been particularly the case for the big guy, China, but some of the other EM stars such as Korea, Brazil, India, and Turkey are also hiking rates as inflation rears its ugly head. Although these inflationary pressures are primarily food-related, output gaps have narrowed, and with growth above potential, and still harboring vivid memories of the autumn of 2008, the authorities are reacting peremptorily. Perhaps too peremptorily? Are they fighting the last war rather than the current one? Meanwhile, the currencies of EM countries are appreciating, which is another form of tightening.
Since food prices are a major component of the overall consumption basket in these countries, it is understandable that their central banks are so sensitive. Food prices are around 30% in most in the major EM countries, compared with 15% in the U.S. and Euroland. Yeah, food is important, but I’ve never quite understood how raising interest rates cures a drought or ameliorates crop failures. Admittedly, monetary policy may have been too stimulative and perhaps has worked too well, but that’s not a bad problem to have in a world whose economy is still not out of the recovery ward and where the biggest worry in the major developed countries is deflation, not inflation.
Nevertheless, we are where we are, and the emerging markets may continue to lag U.S. equities coming out of the gate here in 2011. However I’m convinced that being shamelessly fat, the emerging market is the threshold asset allocation decision for the longer-term investor. How much should you have in EM equities and debt? A lot more than you do now! The EM economies are 37% of world GDP but should be 50% in ten years and over 60% by 2030. The EM equity weight in the benchmark MSCI World Index is now 13%, and the consultants estimate the institutions of the so-called developed world have only a 6% weighting in EM equities. At the same time, using a complex model that is a function of growth in employment, capital stock, and total factor productivity, Goldman Sachs forecasts around 5.5% real GDP growth for the ten major EM countries, compared with 2.5% for the U.S. and more like 1.5% for Europe and even less for Japan. EM economies are growing faster because of rising productivity, a faster-growing labor force, higher participation rates, and increasing capital investment per worker.
I think these numbers are about right. It’s hard to see with the demographics, participation rates, and the flaccid work ethic of the developed economies how growth is going to exceed these forecasts. However economic growth does not necessarily determine the potential of a country’s profits and national stock market. The companies in the S&P 500 derive over half of their earnings from their international businesses, and about 40% of the 50% is from emerging market operations, and that percentage is rising. Over the long run, the S&P 500’s real earnings per share growth has been just about the same as real GDP growth. For trend-line future growth, let’s assume 2.5% real for the domestic component, 1.5% for the developed international, and 5% for the emerging market part. Overall S&P earnings realistically could trend up at a 3% real rate, which, assuming 3% inflation, translates into 6% per annum nominal. EM earnings growth in line with GDP growth should be about twice as fast, and currency appreciation will add a couple of percentage points a year to GDP growth.
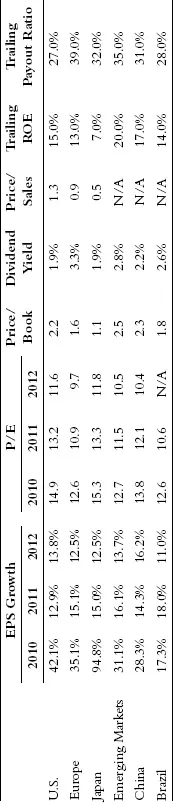
But this is long-term ruminating. For now, I would be about 60% U.S., 6% Europe, and 34% emerging markets. In the U.S., I think it’s still technology, selective big-cap multinationals with major emerging market exposure, oil services, industrial equipment, financials, and big oil. In Europe also there are some multinationals that have strong emerging market franchises. In the emerging markets, I favor China, India, and the likes of Hong Kong, Korea, Taiwan, Indonesia, Turkey, and Brazil. I have liked Thailand, the banks in particular, a lot but the politics are looking dicey again. The table shows some valuation comparisons, using I/B/E/S analysts’ consensus numbers, which should be taken with many grains of salt.
Why do I have quick, nervous feet? Because the economic recovery in the developed economies is still fragile. The piper has not yet been fully paid. Are we really going to get off this easy? The deleveraging process is far from complete. Euroland could blow up. The U.S. housing market is still rickety and choked with inventory. If it continues to free-fall, say hello to the double dip, and the financials will get hit again. A war in Korea or the Middle East would give equity prices a nasty shock.
But if the world holds together reasonably well, equities—while not as cheap as they were—remain the most attractive asset class, and money has to go somewhere. Be an owner rather than a lender.
![]()
Shake Well Before Using
I have long been an aficionado of the emerging markets. It may be presumptuous to say, but I was present when they were created as a true asset class.
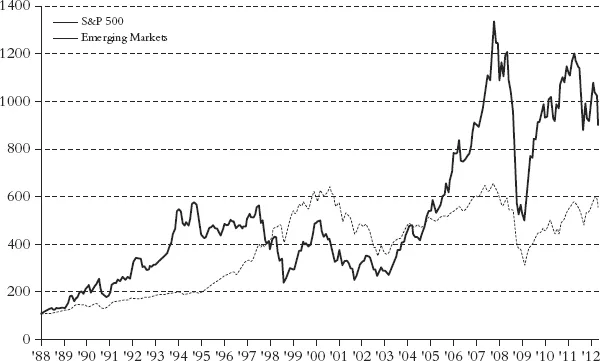
I still believe but as the chart on the next page shows, emerging markets since 1988 have vaulted over eightfold while the S&P 500 has risen a little over five. Adjusted for risk, volatility, and liquidity, the returns are about equal. Am I just chasing my own tail?
January 17, 2011
I believe the most influential, nay crucial, nay magnificent, asset allocation decision for the true long-term investor is the percentage of his or her total equity portfolio allocated to emerging market (EM) equities. By long-term investor, I mean the individual who is thinking about wealth enhancement over a span of two to five years, and the professional who is willing to make a commitment that exposes him or her to considerable benchmark risk. Such a bet could be a make-or-break position, but it’s one I have a high degree of confidence in. I despise running money to minimize benchmark risk. We should not be slaves to the usual equity benchmarks, but neither should we be oblivious to them, so my comments take them into respectful consideration.
Let me present some facts. The EM economies this year will be 37% of the global economy and will account for 75% of the world’s growth. Goldman Sachs (GS) and the World Bank estimate they will be 50% by 2020 and over 60% of the world by 2030. On a so-called purchasing power basis (PPP), EM already will be half of the world this year. PPP GDP calculates the amount of adjustment needed on the exchange rate between countries in order for the exchange to be equivalent to each currency’s purchasing power. In other words, PPP adjusts so that an identical good in two different countries has the same price when expressed in the same currency. The Economist magazine periodically publishes a table that ranks countries on the relative price of purchasing a Big Mac McDonald’s hamburger. As of late last year, a Big Mac in the U.S. cost $3.71 versus $6.78 in Switzerland, $5.26 in Brazil, and $2.18 in China.
Using a complex model that is a function of growth in employment, capital stock, and total factor productivity (faster-growing labor force, higher participation rates, and increasing capital investment per worker), GS forecasts a 20-year compound annual growth rate (CAGR) of real (in other words, inflation adjusted) GDP in local currencies of around 5.5% for the 10 major EMs. This contrasts to a 2.5% CAGR for the U.S. and more like 1% to 1.5% at best for Europe, Germany, and Japan.
Here are the International Monetary Fund’s, GS’s, and my back-of-the-envelope 20-year CAGR forecasts for the major EMs: China 6.5%, India 6.4%, Philippines 5.9%, Malaysia 5.4%, Indonesia 5.1%, Turkey 4.8%, Brazil 4.6%, Mexico 4.4%, Thailand, Israel, South Africa 4.3%, Russia 3.8%, and Korea and Taiwan 3.5%. Since the less mature EMs will even grow faster, the EMs as a group will have CAGR of real GDP over the 20 years of 5.7%. By contrast, the developed economies will chug along at 1.8% per annum, producing total global growth of 4.1%. If these forecasts are right, we will all live happily ever after.
Nevertheless, as we know, 20-year projections are horse manure sprinkled with heroic assumptions, and I don’t necessarily agree with some of these country growth rates, but presumably they were scientifically derived as described above. However, it’s the magnitude of the difference between the developed economies and the EMs that is so overwhelming . . . and compelling!
Developing country currencies have tended to appreciate versus the dollar, the euro, and the yen as higher productivity drives convergence towards PPP exchange rates. Over the long run, this trend should add anywhere from 50 bps to 250 bps per annum to the increase in the EM’s real U.S. dollar GDP. Obviously, currency appreciation is also an important plus for investors who own EM equities!
Unfortunately it’s not GDP progress but earnings per share growth that drives stock prices. Over the long run, the real earnings per share growth of the S&P 500 has be...