Residents in Boston, Massachusetts are automatically reporting potholes and road hazards via their smartphones. Progressive Insurance tracks real-time customer driving patterns and uses that information to offer rates truly commensurate with individual safety. Google accurately predicts local flu outbreaks based upon thousands of user search queries. Amazon provides remarkably insightful, relevant, and timely product recommendations to its hundreds of millions of customers. Quantcast lets companies target precise audiences and key demographics throughout the Web. NASA runs contests via gamification site TopCoder, awarding prizes to those with the most innovative and cost-effective solutions to its problems. Explorys offers penetrating and previously unknown insights into healthcare behavior.
How do these organizations and municipalities do it? Technology is certainly a big part, but in each case the answer lies deeper than that. Individuals at these organizations have realized that they don't have to be Nate Silver to reap massive benefits from today's new and emerging types of data. And each of these organizations has embraced Big Data, allowing them to make astute and otherwise impossible observations, actions, and predictions.
It's time to start thinking big.
In Too Big to Ignore, recognized technology expert and award-winning author Phil Simon explores an unassailably important trend: Big Data, the massive amounts, new types, and multifaceted sources of information streaming at us faster than ever. Never before have we seen data with the volume, velocity, and variety of today. Big Data is no temporary blip of fad. In fact, it is only going to intensify in the coming years, and its ramifications for the future of business are impossible to overstate.
Too Big to Ignore explains why Big Data is a big deal. Simon provides commonsense, jargon-free advice for people and organizations looking to understand and leverage Big Data. Rife with case studies, examples, analysis, and quotes from real-world Big Data practitioners, the book is required reading for chief executives, company owners, industry leaders, and business professionals.
- English
- ePUB (mobile friendly)
- Available on iOS & Android
eBook - ePub
About this book
Trusted by 375,005 students
Access to over 1.5 million titles for a fair monthly price.
Study more efficiently using our study tools.
CHAPTER 1
Data 101 and the Data Deluge
Any enterprise CEO really ought to be able to ask a question that involves connecting data across the organization, be able to run a company effectively, and especially to be able to respond to unexpected events. Most organizations are missing this ability to connect all the data together.
—Tim Berners Lee
Today, data surrounds us at all times. We are living in what some have called the Data Deluge.1 Everything is data. There’s even data about data, hence the term metadata. And data is anything but static; it’s becoming bigger and more dynamic all the time. The notion of data is somewhat different and much more nuanced today than it was a decade ago, and it’s certainly much larger.
Powerful statements like these might give many readers pause, scare some others, and conjure up images of The Matrix. That’s understandable, but the sooner that executives and industry leaders realize this, the quicker they’ll be able to harness the power of Big Data and see its benefits. As a starting point, we must explore the very concept of data in greater depth—and a little history is in order. If we want to understand where we are now and where we are going, we have to know how we got here.
This chapter discusses the evolution of data in the enterprise. It provides an overview of the types of data that organizations have at their disposal today. It answers questions like these: How did we arrive at the Big Data world? What does this new world look like? We have to answer questions like these before we can move up the food chain. Ultimately, we’ll get to the big question: how can Big Data enable superior decision-making?
THE BEGINNINGS: STRUCTURED DATA
Make no mistake: corporate data existed well before anyone ever turned on a proper computer. The notion of data didn’t even arrive years later, when primitive accounting systems became commercially viable. So why weren’t as many people talking about data thirty years ago? Simple: because very little of it was easily (read: electronically) available.
Before computers became standard fixtures in offices, many companies paid employees via manual checks; bookkeepers manually kept accounting ledgers. The need for public companies to report their earnings on quarterly and annual bases did not start with the modern computer. Of course, thirty years ago, organizations struggled with this type of reporting because they lacked the automated systems that we take for granted today. While calculators helped, the actual precursor to proper enterprise systems was VisiCalc. Dan Bricklin invented the first spreadsheet program in the mid-1970s, and Bob Frankston subsequently refined it.
In the mid-1980s, user-facing or front-end applications like manufacturing resource planning (MRP) and enterprise resource planning (ERP) systems began to make inroads. At a high level, these systems had one goal: to automate standard business processes. To achieve this goal, enormous mainframe databases supported these systems. For the most part, these systems could only process structured data (i.e., “orderly” information relating to customers, employees, products, vendors, and the like). A simple example of this type of data is presented in Table 1.1.
Table 1.1 Simple Example of Structured Customer Master Data
| CustomerID | CustomerName | ZipCode | ContactName |
| 1001 | Bally’s | 89109 | Jon Anderson |
| 1002 | Bellagio | 89109 | Geddy Lee |
| 1003 | Wynn Casino | 89109 | Mike Mangini |
| 1004 | Borgata | 08401 | Steve Hogarth |
| 1005 | Caesar’s Palace | 89109 | Brian Morgan |
Now a master customer table can only get so big. After all, even Amazon.com “only” serves 300 or 400 million customers—although its current internal systems can support many more times that number. Tables get much longer (not wider) when they contain transactional data like employee paychecks, journal entries, or sales. For instance, consider Table 1.2.
Table 1.2 Simple Example of Transactional Sales Data
| OrderNbr | CustomerID | ProductID | OrderDate | ShipDate |
| 119988 | 1001 | 2112 | 1/3/13 | 1/6/13 |
| 119989 | 1002 | 1234 | 1/6/13 | 1/11/13 |
| 119990 | 1001 | 2112 | 1/6/13 | 1/9/13 |
| 119991 | 1004 | 778 | 1/6/13 | 1/12/13 |
| 119992 | 1004 | 999 | 1/7/13 | 1/15/13 |
In Table 1.2, we see that many customers make multiple purchases from a company. For instance, I am an Amazon customer, and I buy at least one book, DVD, or CD per week. I have no doubt that each sale represents an individual record in a very long Amazon database table somewhere. (Amazon uses this data for two reasons: [1] process my payments; and [2] learn more about my purchasing habits and recommend products that, more often than not, I consider buying.)
Things are orderly under a relational data model. All data is stored in proper tables, and each table is typically joined with at least one other. Each table is its own entity. An Entity Relationship Diagram (ERD) visually represents the relationships between and among tables. A simple example of an ERD is shown in Figure 1.1.
Figure 1.1 Entity Relationship Diagram (ERD)
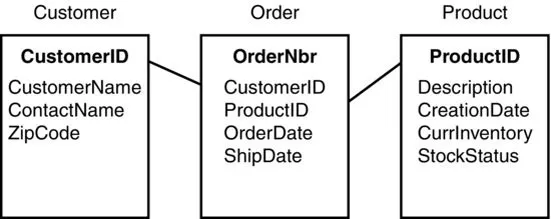
Note that the ERD in Figure 1.1 is nothing like what you’d find behind the scenes in most large organizations. It’s common for enterprise systems to contain thousands of individual tables (including some customized ones), although not every table in a commercial off the shelf (COTS) system contains data. Also, querying data from multiple tables requires JOIN statements. While you can theoretically query as many data sources and tables as you like (as long as they are properly joined), queries with a high number of huge tables tend to take a great deal of time to complete.14 Queries improperly or inefficiently written can wreak havoc across an entire enterprise.
Throughout the 1990s and early 2000s, more and more organizations deployed systems built upon this relational data model. They uprooted their legacy mainframe systems and supplanted them with contemporary enterprise applications. Importantly, these applications were powered by orderly and expensive relational databases like Oracle, SQL Server, and others. What’s more, organizations typically converted their legacy data to these new systems by following a process called ETL (extract, transform, and load).15
Like their predecessors, ERP and CRM systems excelled at handling structured data, performing essential business functions like paying vendors and employees, and providing standard reports. With these systems, employees could enter, edit, and retrieve essential enterprise information. Corporate intranets, wikis, and knowledge bases represented early attempts to capture unstructured data, but most of this data was internal (read: generated by employees, not external entities). For the most part, intranets have not displaced e-mail as the de facto killer app inside many large corporations.
When asked about data, most people still only think of the structured kind mentioned in this section. “The relational model has dominated the data management industry since the 1980s,” writes blogger Jim Harris on the Data Roundtable. That model “foster(s) the long-held belief that data has to be structured before it can be used, and that data should be managed following ACID (atomicity, consistency, isolation, durability) principles, structured primarily as tables and accessed using structured query language (SQL).”2 Harris is spot-on. The relational data model is still very important, but it is no longer the only game in town. It all depends on the type and source of data in question.

Even in a Big Data world, transactional and structured data and the relational databases behind them are far from irrelevant. But organizations need to start leveraging new data sources and solutions.
STRUCTURE THIS! WEB 2.0 AND THE ARRIVAL OF BIG DATA
While business information is as old as capitalism itself, the widespread use of corporate data is a relatively recent development. The last section demonstrated how, in the 1980s and 1990s, relational databases, ERP and CRM applications, business automation, and computers all helped popularize the contemporary notion of data. Over the past few decades, organizations have begun gradually spending more time, money, and effort managing their data, but these efforts have tended to be mostly internal in nature. That is, organizations have focused on what the data generated by their own hands.
In or around 2005, that started to change as we entered Web 2.0—aka the so...
Table of contents
- Cover
- Praise
- Wiley & SAS Business Series
- Title Page
- Copyright
- Other Books by Phil Simon
- Epigraph
- List of Tables and Figures
- Acknowledgments
- Preface
- Introduction: This Ain’t Your Father’s Data
- Chapter 1: Data 101 and the Data Deluge
- Chapter 2: Demystifying Big Data
- Chapter 3: The Elements of Persuasion: Big Data Techniques
- Chapter 4: Big Data Solutions
- Chapter 5: Case Studies: The Big Rewards of Big Data
- Chapter 6: Taking the Big Plunge
- Chapter 7: Big Data: Big Issues and Big Problems
- Chapter 8: Looking Forward: The Future of Big Data
- Final Thoughts
- Selected Bibliography
- About the Author
- Index
Frequently asked questions
Yes, you can cancel anytime from the Subscription tab in your account settings on the Perlego website. Your subscription will stay active until the end of your current billing period. Learn how to cancel your subscription
No, books cannot be downloaded as external files, such as PDFs, for use outside of Perlego. However, you can download books within the Perlego app for offline reading on mobile or tablet. Learn how to download books offline
We are an online textbook subscription service, where you can get access to an entire online library for less than the price of a single book per month. With over 1.5 million books across 990+ topics, we’ve got you covered! Learn about our mission
Look out for the read-aloud symbol on your next book to see if you can listen to it. The read-aloud tool reads text aloud for you, highlighting the text as it is being read. You can pause it, speed it up and slow it down. Learn more about Read Aloud
Yes! You can use the Perlego app on both iOS and Android devices to read anytime, anywhere — even offline. Perfect for commutes or when you’re on the go.
Please note we cannot support devices running on iOS 13 and Android 7 or earlier. Learn more about using the app
Please note we cannot support devices running on iOS 13 and Android 7 or earlier. Learn more about using the app
Yes, you can access Too Big to Ignore by Phil Simon in PDF and/or ePUB format, as well as other popular books in Business & Business Strategy. We have over 1.5 million books available in our catalogue for you to explore.