![]()
CHAPTER 1
Brief Review of Hypothesis Testing Concepts/Issues and Confidence Intervals
Statistical techniques are used for purposes such as estimating population parameters using either point estimates or interval estimates, developing models, and testing hypotheses. For each of these uses, a sample must be obtained from the population of interest. The immediate question is then “How large should the sample be?” That is the focus of this book. There are several types of sampling methods that are used, such as simple random sampling, stratified random sampling, and cluster sampling. Readers interested in learning about these methods are referred to books on sampling. Such books range from books with an applied emphasis such as Thompson (2012) to an advanced treatment with some theoretical emphasis as in Lohr (2010). Readers interested in an extensive coverage of sample survey methodology may be interested in Groves, Fowler, Couper, Lepkowski, Singer, and Tourangeau (2009).
1.1 BASIC CONCEPTS OF HYPOTHESIS TESTING
If sampling is very inexpensive in a particular application, we might be tempted to obtain a very large sample, but settle for a small sample in applications where sampling is expensive.
The cliché “the bigger the better” can cause problems that users of statistical methods might not anticipate, however. To illustrate, assume that there are two alternative methods that could be employed at some stage of a manufacturing process, and the plant manager would like to determine if one is better than the other one in terms of process yield. So an experiment is performed with one of the methods applied to thousands of units of production, and then the other method applied to the same number of units.
What is likely to happen if a hypothesis test (also called a significance test) is performed, testing the equality of the population means (i.e., the theoretical average process yield using each method), against the alternative hypothesis that those means are not equal? Almost certainly the test will lead to rejection of the (null) hypothesis of equal population means, but we should know that the means, recorded to, say, one decimal place are not likely to be equal before we even collect the data! What is the chance that any two U.S cities, randomly selected from two specified states, will have exactly the same population? What is the probability that a company's two plants will have exactly the same proportion of nonconforming units? And so on. The bottom line is that null hypotheses (i.e., hypotheses that are tested) are almost always false. This has been emphasized in the literature by various authors, including Nester (1996) and Loftus (2010).
Other authors have made similar statements, although being somewhat conservative and less blunt. For example, Hahn and Meeker (1991, p. 39) in pointing out that hypothesis tests are less useful than confidence intervals stated: “Thus, confidence intervals are usually more meaningful than statistical hypothesis tests. In fact, one can argue that in some practical situations, there is really no reason for the statistical hypothesis to hold exactly.”
If null hypotheses are false, then why do we test them? [This is essentially the title of the paper by Murphy (1990).] Indeed, hypothesis testing has received much criticism in the literature; see, for example, Nester (1996) and Tukey (1991). In particular, Loftus (1993) stated “First, hypothesis testing is overrated, overused, and practically useless as a means of illuminating what the data in some experiment are trying to tell us.” Provocative discussions of hypothesis testing can also be found in Loftus (1991) and Shrout (1997). Howard, Maxwell, and Fleming (2000) discuss and endorse a movement away from heavy reliance on hypothesis testing in the field of psychology. At the other extreme, Lazzeroni and Ray (2012) refer to millions of tests being performed with genomics data.
Despite these criticisms, a decision must be reached in some manner about the population parameter(s) of interest, and a hypothesis test does directly provide a result (“significant” or “not significant”) upon which a decision can be based. One of the criticisms of hypothesis testing is that it is a “yes–no” mechanism. That is, the result is either significant or not, with the magnitude of an effect (such as the effect of implementing a new manufacturing process) hidden, which would not be the case if a confidence interval on the effect were constructed.
Such criticisms are not entirely valid, however, as the magnitude of an effect, such as the difference of two averages, is in the numerator of a test statistic. When we compute the value of a test statistic, we can view this as a linear transformation of an effect. For example, if we are testing the null hypothesis,
, which is equivalent to
, the difference in the two parameters is estimated by the difference in the sample averages,
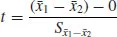
, which is in the numerator of the test statistic,
with
denoting the standard error (i.e., estimator of the standard deviation) of
, and 0 is the value of
under the null ypothesis. Thus, the “effect,” which is estimated by
, is used in computing the value of the test statistic, with every type of
t-statistic having the general form:
t = estimator/standard error of estimator.
Many practitioners would prefer to have a confidence interval on the true effect so that they can judge how likely the true (unknown) effect,
, is to be of practical significance. For example, Rhoads (1995) stated that many epidemiologists consider confidence intervals to be more useful than hypothesis tests. Confidence intervals are reviewed in Section 1.2.
In using the test statistic in Eq. (1.1) to test the null hypothesis of equal population means, we must have either a reference value in mind such that if the test statistic exceeds it in absolute value, we will conclude that the means differ, or, as is commonly done, a decision will be based on the “p-value,” which is part of the computer output and is the probability of obtaining a value of the test statistic that is more extreme, relative to the alternative hypothesis, as the value that was observed, conditioned on the null hypothesis being true. As discussed earlier in this section, however, null hypotheses are almost always false, which implies that p-values are hardly ever valid. Therefore, the p-values contained in computer software output should not be followed slavishly, and some people believe that they shouldn't be used at all (see, e.g., Fidler and Loftus, 2009).
If we use the first approach, the reference value would be the value of the test statistic determined by the selected significance level, denoted by α, which is the probability of rejecting a (conceptually) true null hypothesis. This is also called the probability of a Type I error. If the test is two-sided, there will be two values that are equal in absolute value, such as ±1.96, with the null hypothesis rejected if the test statistic exceeds 1.96 or is less than −1.96. If we adopt the second approach and, for example, p = .038, we may (or may not) conclude that the null hypothesis is false, whereas there would be no doubt if p = .0038, since that is a very small number and in particular is less than .01. (Recall the discussion about null hypotheses almost always being false, however.)
There are four possible outcomes of a hypothesis test, as the null hypothesis could be (1) correctly rejected, (2) incorrectly rejected, (3) correctly not rejected, or (4) incorrectly not rejected. The latter is called a Type II error and the probability of a Type II error occurring is denoted by β. Thus, 1 − β is the probability of correctly rejecting a false null hypothesis and this is termed “the power of the test.” An experimenter must consider the costs associated with each type of error and the cost of sampling in arriving at an appropriate sample size to be used in hypothesis tests, as well as to determine an appropriate sample size for other purposes.
Some practitioners believe that the experiments should be conducted with the probability of a Type I error set equal to the probability of a Type II error. Although the former can literally be “set” by simply selecting the value, the latter depends on a number of factors, including the difference between the hypothesized parameter value and the true parameter value α, the standard deviation of the estimator of the parameter, and the sample size. We cannot literally set the probability of a Type II error because, in particular, the standard deviation of the estimator of the parameter will be unknown. So even though we may think we are setting the power for detecting a certain value of the parameter with the software we use, we are not literally doing so since the value for the standard deviation that the user must enter in the software is almost certainly not the true value.
Since α ≤ .10, typically, and usually .05 or .01, this would mean having power ≥ .90 since power = 1 − β, as stated previously. Although this rule-of-thumb may be useful in some applications, it would result in a very large required sample size in many applications since increased power means increased sample size and power of .95 or .99 will often require a much larger sample size than power = .90, depending on the value of the standard error. Thus, in addition to being an uncommon choice for power, .95 or .99 could require a sample size that would be impractical. The increased sample size that results from using .95 or .99 is illustrated in Section 3.1.
Regarding the choice of, α one of my old professors said that we use .05 because we have five fingers on each hand, thus making the point that the selection of .05 is rather arbitrary. Mudge, Baker, Edge, and Houlahan (2012) suggested that α be chosen to either (a) minimizing the sum of the probability of a Type I error plus the probability of a Type II error at a critical effect size, or (b) “minimizing the overall cost asso...