This book is intended for applications of online digital mapping, called mashups (or composite application), and to analyze the mapping practices in online socio-technical controversies. The hypothesis put forward is that the ability to create an online map accompanies the formation of online audience and provides support for a position in a debate on the Web.
The first part provides a study of the map:
- a combination of map and statistical reason
- crosses between map theories and CIS theories
- recent developments in scanning the map, from Geographic Information Systems (GIS) to Web map.
The second part is based on a corpus of twenty "mashup" maps, and offers a techno-semiotic analysis highlighting the "thickness of the mediation" they are in a process of communication on the Web. Map as a device to "make do" is thus replaced through these stages of creation, ranging from digital data in their viewing, before describing the construction of the map as a tool for visual evidence in public debates, and ending with an analysis of the delegation action against Internet users.
The third section provides an analysis of these mapping practices in the case study of the controversy over nuclear radiation following the accident at the Fukushima plant on March 11, 2011. Techno-semiotic method applied to this corpus of radiation map is supplemented by an analysis of web graphs, derived from "digital methods" and graph theory, accompanying the analysis of the previous steps maps (creating Geiger data or retrieving files online), but also their movement, once maps are made.
- English
- ePUB (mobile friendly)
- Available on iOS & Android
eBook - ePub
About this book
Trusted by 375,005 students
Access to over 1.5 million titles for a fair monthly price.
Study more efficiently using our study tools.
Information
PART ONE
Origins and Properties of Online Maps
1
Tooling up for Complexity
“Cartographic objects” are subject to Jack Goody’s reflection on the “graphic reason” describing the impact of the graphic form of information on how to apprehend it [GOO 77]. But maps are not merely tools to visualize information; they also have a logistic function. Analyzing how the uses of cartography changed during the 19th Century reveals the emergence of its role as a tool to manage complexity [ROB 08a]. Maps were transferred in the 19th Century from the hands of geographers to those of engineers [PAL 96] as a consequence of an effort to standardize metrology [FLI 04: 25], of a sufficient topological survey and of an increase in the needs for human and territorial management, described as statistical reasoning [DES 10]. This rationalization through maps is illustrated by its use in new sectors such as urban planning and medicine: these two case studies of map uses provides an introduction to the relation between science and politics, which are still present today.
1.1. Maps as intellectual technology
As we analyze the overlap of writing and image within maps, Anne-Marie Christin’s thesis on the “graphic un-reason”, which she elaborated through her discussion with Jack Goody on the notion of “graphic reason”, comes to mind. Maps as “intellectual technology” enable us to collect and circulate writings [LAT 85], which Pascal Robert [ROB 08a] takes further by emphasizing the logistic uses of maps to manage complexity.
1.1.1. Between graphic reason and unreason
Although Jack Goody did not work with maps, he put forward the cognitive effects of writing. He proposed defining writing as an “intellectual technology”:
Especially when I speak of writing as a technology of the intellect, I refer not just to pen and paper, stylus and tablet, as complex as these instruments are, but to the training required, the acquisition of new motor skills, and the different uses of eyesight, as well as to the products themselves, the books that are stacked on the library shelves, objects that one consults and from which one learns, and which one may also, in time, compose. [GOO 00, p.133]
Here, he refers to writing as an ecosystem which relates its most material manifestations (book, paper, pen) to its most abstract consequences (formation, cognitive effects). Within this heterogeneous mix, the formalizing effect of writing has an impact on the cognitive and intellectual work, which is encompassed by the notion of “graphic reason.” The latter is set up through what Goody names intellectual technologies, which are the table, the list and the formula and have taken part in the “Domestication of the Savage Mind” [GOO 77]. Goody describes the characteristic of the list as follows:
The list relies on discontinuity rather than continuity; it depends on physical placement, on location; it can be read in different directions, both sideways and downwards, up and down, as well as left and right; it has a clear-cut beginning and a precise end, that is, a boundary, an edge, like a piece of cloth. Most importantly it encourages the ordering of the items, by number, by initial sound, by category, etc. And the existence of boundaries, external and internal, brings greater visibility in categories, at the same time as making them more abstract. [GOO 77, p.81]
Anne-Marie Christin takes Jack Goody’s notion of “graphic reason” one step further into the analysis of the relationship between text and image. For her, writing should not be defined primarily as a means of merely registering speech as it is often portrayed. Christin claims that writing has its origins in image and in the spatial disposition of elements [CHR 95]. She also goes further than Leroi-Gourhan: in Le geste et la parole [LER 64], the latter acknowledges the contribution of mythography as a way of encouraging the development of writing. Similarly, she questions the arche-writing project by Jacques Derrida [DER 67] which leaves little space, she claims, to the spatial origins of writing.
Christin recognizes Jack Goody’s emphasis on the role played by graphic reason in the history of writing [CHR 95, p.28]. However, she reproaches him for minimizing the overlap of graphic reason and writing, and the classification possibilities it opens. Christin even argues that the image came before writing:
The written language could only have been produced by the spoken language as litter, a parasite. The spoken language only creates in relation to itself or in its close dependence. The image, on the contrary, shows a new characteristic of writing in that it was born from the image’s overturn, its internal revolution, in the same way as the Greek alphabet will be born from the overturn of writing. [CHR 95, p.21]
According to Christin, it is the image that led to realizing the expressive potential of writing. Indeed, images have created a “screen thinking” which preceded the invention of writing. Christin uses as evidence the spacing between the elements in medieval paintings, which gave rise to the discretization between words [CHR 09]. Following this hypothesis, maps hold a special place as they are a demonstration of the “graphic unreason” hypothesis:
If, with the invention of the alphabet, writing had lost the semiotic relations that tied it to its support, the latter came back through geographical description. [CHR 95, p.121]
Maps constantly remind us of the graphic origins of writing as they rely on bringing elements into view and placing the distance of the logos to offer a graphic apprehension of space:
This [cartographic] system is remarkable in that it reinvents writing by adding a purely visual procedure to speech – or it shows how useful writing is by translating its original ideographic principle […] into cultural terms. Writing is useful not because of its truthfulness to the art of memory or discourse – as these operate in completely different ways – but for its effectiveness. The usefulness of writing is conditioned by two rules: the investment of the gaze in a given space and the emergence within this space of participating figures, both signs and symbols, from the world of language and imaging. [CHR 95, p.122]
In this case, the map embodies the graphic origin of writing.
1.1.2. The collection of writings
As a result of the previously mentioned debates concerning the origins and cognitive consequences of writing, Bruno Latour [LAT 85] put forward the recording and diffusion functions of writing through the map. He refers to Goody and aims to go beyond scientific discourses to explore the practical reality of maps. Scientists tautologically explain the validity of science through the rejection of non-scientific thinking. Latour’s hypothesis on the other hand is that the difference between science and non-science does not reside in overcoming the myth of the “savage mind” by the rigor of the “scientific mind”, but that it results from a change in the status of writing. To support this hypothesis, Bruno Latour draws a parallel between the role of Goody’s list and that of printing according to Elizabeth Eisenstein [EIS 83]. Both keep writings that are scattered geographically on the same support and in the same place [LAT 85, p.5]. Therefore, the domestication of the savage mind does not refer to the passage from a primitive mind to a scientific mind but to the logistical function of intellectual technologies which facilitate settling, circulating and accumulating documents used in the scientific practice.
In this view, maps are excellent tools for observing the collection of writings. They are “immutable mobiles” [LAT 85, p.11] which enclose the writings while making them mobile in order to bring them to the laboratory. Latour illustrates this characteristic of maps through an anecdote during the exploration of the Sakhaline island by La Pérouse [LAT 85, p.9]. After landing on the island, the latter asked the inhabitants to draw a map of the island for him in the sand. The map was erased by the rising tide, so one of the inhabitants took La Pérouse’s notebook and drew the map in it. Two different statuses of writing are illustrated here: for the inhabitants of the island, the map is ephemeral and its drawing preserves its indexicality; whereas for La Pérouse, this representation of the island is the very aim of the entire expedition, namely deciding whether Sakhaline is an island or a peninsula. The transformation of an ephemeral map in an immutable mobile through its drawing in a notebook enables La Pérouse to bring it back to the King and gather evidence of its existence as an island1.
1.1.3. Managing complexity
Why are maps as effective as “immutable mobiles”?
Only man can really dominate: everything is too large or too small for him, too mixed up or made up of successive layers that conceal what he would like to see. Yes! Yet one thing can be dominated by his gaze: a sheet of paper laid across a table or stuck on a wall. The history of science and technology is mostly the result of tricks that have brought the world onto this piece of paper. Then the mind can see it and dominate it. Nothing can be concealed or hidden in the dark. [LAT 85, p.21]
In this excerpt, the map has two functions. First, it gives a synoptic idea of an event that is too great to be apprehended physically. Second, it embodies the effort required to make all the elements hold on its surface: these “tricks” Latour was referring to about the island of Sakhaline point to methods of converting a set of information into a map.
The double status of the map shown in the previous quote, both as a synoptic representation and as the translation of information on a given support, introduces Pascal Robert’s concept of maps as intellectual technology. He takes Goody’s definition further by portraying the map as a means of creating knowledge, and adds a management and logistical dimension to writing. He takes the example of the Great Mesopotamian and Egyptian States which, because of writing, disposed of a way of managing their populations and goods [ROB 08a]. According to his theory, the intellectual technologies operate by changing the dimensions of things; they make a phenomenon easier to apprehend by transforming it into a document. So intellectual technologies are “regulated complexity management tools that translate an event into a document by changing its dimensions” [ROB 00, p.103]. Extending the analysis of the place of instruments in the sociology of sciences, the totality of the writings is enclosed into a document defined by notions of stability, mobility and accumulation [ROB 00, p.113].
Following this definition, maps are, for Robert, a paradigmatic example of intellectual technology:
– Maps are regulated tools with their own apparatus developed over time.
– They are the means for transferring information from one surface to another in the same way as parchment, paper or a screen, which help to translate the elements represented on them.
– Their synoptic nature enables us to visualize simultaneously a large number of elements and to juxtapose and compare different components on the map [ROB 08a, p.37-38].
As information-management tools, three properties make maps particularly effective to acquire, register and circulate writings. Defined as intellectual technology, they combine functions of support, analysis and logistical information processing.
1.2. A shift in the uses of maps
If maps were mostly used since their invention for their visualization and information-management functions, they became more and more used over the 19th Century for the collection and circulation of writings. This shift from topographic to thematic maps triggered the use of maps as instruments of public action [LAS 07] as shown by the uses made by engineers and doctors.
1.2.1. From topographic to thematic maps
Topographic maps, which facilitated visualization of the physical elements in the represented space, boomed over the 17th and 18th Centuries. In France, this is best illustrated by the work by the Cassini family. The story of the Cassini cartography started with Giovanni Domenico Cassini’s invitation to the Royal Academy of Paris in 1669. He was to make a comprehensive survey of France in order to fill the gaps in the map of the Academy2. This is how four generations of this family worked to improve the topographic survey data on France. Their work was punctuated by particular requests (in 1747 for instance, Louis XV requested a more precise map, at a scale of 1: 86 400) and by interruptions of funding (as in 1756, the King judged the project too expensive; so Cassini III set up a private company and developed trade in maps). This long-term project came to an end in 1815 with the end of the war, through the production of a map of France [HEA 02].
After this extensive work on topographic maps, the 19th Century witnessed the generalization of thematic maps. These refer to maps in which the topological elements are not the endpoints but rather serve to plot other types of information, phenomena or events [THR 72, p.64]. Edmond Halley had already opened the way to the use of maps as analytical instruments through his Map of the Winds in 1686. A few years later, he also provided maps with magnetic declination, which marked the “beginning of the modern language of thematic cartography” [PAL 96, p.40].
In spite of these breakthroughs, thematic maps struggled to develop throughout the 18th Century due to a lack of data. Only in the 19th Century, due to the crossing of the emerging “statistical reasoning” [DES 10] and the departure from the “metrological chaos” of those times [FLI 04, p.25], did the data start to appear in high quantities, thereby fuelling the production of thematic maps.
1.2.2. The rise of the graphic representation of information
The appropriation of maps by engineers and physicians follows various individual pieces of work on the graphic representation of information. Throughout the 18th Century, graphic abstraction was only conceivable if accompanied by text and was only used to add information to the text [HEA 02, p.124]. The book by Joseph Priestley, A Chart of Biography (1756), is representative of this status: it shows a time line of the lives of 2,000 famous historical figures, but is accompanied by an index of 72 pages in which Priestley justifies his use of graphs by explaining how they contribute to the representation of human lives. The extent of the precautions taken by Priestley to explain his choice reveals the symbolic importance of text in relation to the graphic representation of information. Although hesitant, Priestley’s work is the first step to the use of graphs.
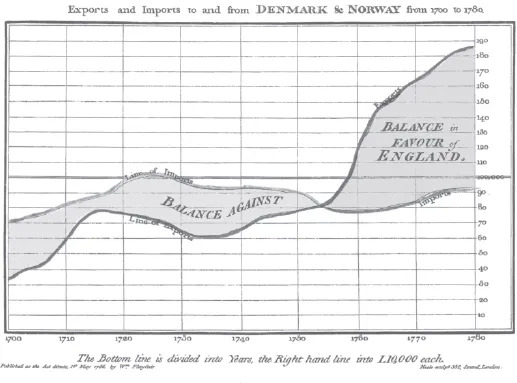
It is through the work of publicist William Playfair that a more significant use of graphs appeared, with the Commercial and Political Atlas issued in 1786. Playfair defends the relevance of two-dimensional representations and thereby steps out of the linearity of the previous graphical representations. He was one of the pioneers of using economics data in charts; he also introduced different types of diagrams. Playfair advocated for these forms of data representation as they are supposed to increase the “efficiency” of the communication process; furthermore, their summarizing properties enable the readers to “absorb more easily” a large amount of information [HEA 02, p.127].
Figure 1.1. Chronology of external trade between England and Scandinavia, William Playfair, Commercial and political Atlas, 17863
Around the same time, the birth of statistics required a change in mentality in order to analyze social components (such as criminality or epidemics) as a result of purely human factors, as opposed to divine or metaphysical ones [HEA 02]. The use of statistics illustrates the thesis of Michel Foucault on the “birth of Man” in sciences, becoming both “what must be thought and what is to be known” [FOU 66, p.356]. Man becomes the basis of this new episteme:
Man was becoming that through which all knowledge could be formed ...
Table of contents
- Cover Page
- Contents
- Title Page
- Copyright Page
- Introduction
- PART ONE: Origins and Properties of Online Maps
- PART TWO: Mapping Practices in Emergency Situations
- Conclusion
- Bibliography
- Index
Frequently asked questions
Yes, you can cancel anytime from the Subscription tab in your account settings on the Perlego website. Your subscription will stay active until the end of your current billing period. Learn how to cancel your subscription
No, books cannot be downloaded as external files, such as PDFs, for use outside of Perlego. However, you can download books within the Perlego app for offline reading on mobile or tablet. Learn how to download books offline
Perlego offers two plans: Essential and Complete
- Essential is ideal for learners and professionals who enjoy exploring a wide range of subjects. Access the Essential Library with 800,000+ trusted titles and best-sellers across business, personal growth, and the humanities. Includes unlimited reading time and Standard Read Aloud voice.
- Complete: Perfect for advanced learners and researchers needing full, unrestricted access. Unlock 1.5M+ books across hundreds of subjects, including academic and specialized titles. The Complete Plan also includes advanced features like Premium Read Aloud and Research Assistant.
We are an online textbook subscription service, where you can get access to an entire online library for less than the price of a single book per month. With over 1.5 million books across 990+ topics, we’ve got you covered! Learn about our mission
Look out for the read-aloud symbol on your next book to see if you can listen to it. The read-aloud tool reads text aloud for you, highlighting the text as it is being read. You can pause it, speed it up and slow it down. Learn more about Read Aloud
Yes! You can use the Perlego app on both iOS and Android devices to read anytime, anywhere — even offline. Perfect for commutes or when you’re on the go.
Please note we cannot support devices running on iOS 13 and Android 7 or earlier. Learn more about using the app
Please note we cannot support devices running on iOS 13 and Android 7 or earlier. Learn more about using the app
Yes, you can access Participatory Mapping by Jean-Christophe Plantin in PDF and/or ePUB format, as well as other popular books in Physical Sciences & Geography. We have over 1.5 million books available in our catalogue for you to explore.