![]()
Chapter 1
Introduction: Why Mixed Models?
Big ideas have many names and applications. Sometimes the mixed model is called the model for repeated measurements, sometimes a hierarchical model. Sometimes the mixed model is used to analyze clustered or panel data, sometimes longitudinal data.
Mixed model methodology brings statistics to the next level. In classical statistics a typical assumption is that observations are drawn from the same general population and are independent and identically distributed. Mixed model data have a more complex, multilevel, hierarchical structure. Observations between levels or clusters are independent, but observations within each cluster are dependent because they belong to the same subpopulation. Consequently, we speak of two sources of variation: between clusters and within clusters.
Mixed model is also well suited for the analysis of longitudinal data, where each time series constitutes an individual curve, a cluster. Mixed model is well suited for biological and medical data, which display notorious heterogeneity of responses to stimuli and treatment. An advantage of the mixed model is the ability to genuinely combine the data by introducing multilevel random effects. Mixed model is a nonlinear statistical model, due mainly to the presence of variance parameters, and thus it requires special theoretical treatment. The goal of this book is to provide systematic coverage and development of all spectra of mixed models: linear, generalized linear, and nonlinear.
The aim of this chapter is to show the variety of applications for which the mixed model methodology can be useful, or even a breakthrough. For example, application of mixed modeling methodology to shape and image analysis seems especially exciting and challenging.
Mixed models can be used for the following purposes:
- To model complex clustered or longitudinal data.
- To model data with multiple sources of variation.
- To model biological variety and heterogeneity.
- As a compromise between the frequentist and Bayesian approaches.
- As a statistical model for the penalized log-likelihood.
- To provide a theoretical basis for the Healthy Akaike Information Criterion (HAIC).
- To cope with parameter multidimensionality.
- As a statistical model to solve ill-posed problems, including image reconstruction problems.
- To model shapes and images.
An important feature of this book is that it provides numerical algorithms as a realization of statistical methods that it develops. We strongly believe that an approach is not valuable without an appropriate efficient algorithm. Each chapter ends with a summary points section that may help the reader to quickly grasp the chapter’s major points.
1.1 Mixed effects for clustered data
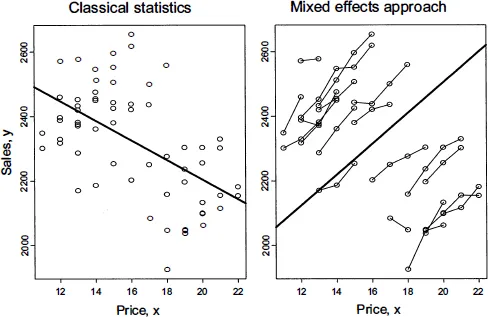
The mixed effects approach copes with clustered data that can be viewed as a sample of samples. To illustrate, let us consider the relationship between price (x) and sales (y). Let {(xk, yk), k = 1,…, K} be the sample of observations collected on price and sales for several commodities. Plotting y versus x reveals that the relationship is close to linear with a negative slope; see the left-hand panel in Figure 1.1. In classical statistics it is assumed that pairs (xk, yk) are independent and identically distributed (iid) with the regression line E(y|x) = α + βx. However, one may argue that we deal with clustered data, where each cluster is a commodity. In the right-hand panel, we connect observation points for each commodity and obtain a reverse picture—increase in price leads to increase in sales. A paradox?
Classical statistics assumes the model
where the {εk} are independent and identically distributed random variables with zero mean and constant variance σ2. In other words, it is assumed that the data are collected from similar, homogeneous commodities. As follows from the right panel, the commodities are not homogeneous and vary substantially in terms of price and sales. An adequate model for the sales problem would be to assume that each commodity has its own commodity-specific sales (in statistical language, intercept); namely,
Note that we use a double index now because we are dealing with clustered/panel/tabular data: i corresponds to the ith commodity, j corresponds to the jth observation of the ith commodity, ni is the number of observations for the ith commodity, and αi is the ...