![]()
Part I
The Active Management Business
![]()
Chapter 1
The Economics of Active Management
Active management is at best a zero-sum game. It means that, collectively, we cannot beat the market, since the collectivity of all investors is the market. Therefore, as a single investor among many, we can only beat the market at the expense of someone else. It becomes a negative-sum game once we incorporate the fees required by active managers, and other costs imposed by active management, such as trading and administration. The more money we collectively pour into expensive active management, the more likely we are to collectively get poorer.
Imagine a group of four individuals, each wanting to share an apple pie. We could agree initially that each individual deserves a slice of equal size (i.e., a form of neutral indexed position), but one individual wants a bigger serving. He can only do so at the expense of someone else. The pie will not get bigger simply because he wants to have more of it.
In order to have a chance to get a bigger slice of the pie, our individual must be willing to risk losing a portion of his slice, and find at least one other individual who is willing to do the same thing. These two individuals will play heads or tails. Whoever wins the coin toss gets a bigger portion, and the loser gets a smaller portion. The same goes for active management. It is at best a zero-sum game.
Now let's assume these two individuals want to increase their chances of winning a bigger slice, and each hires an expert at tossing coins. They will pay these experts by giving them a portion of their slice. Since our two betting individuals have to share their two slices of the pie with others, the portions left for these two individuals are smaller than two full slices. Much like active management, the presence of a new player and his or her fees have transformed this situation into a negative-sum game, and to be a winner, you have to win in the coin toss a portion of the pie that is bigger than the one you are giving to your coin-tossing expert.
How much of their returns are investors giving to the financial industry? No one really knows for sure, but according to John C. Bogle, founder and retired CEO of The Vanguard Group, the wealth transfer in the United States in 2004 from investors to investment bankers, brokers, mutual funds, pension management, hedge funds, personal advisors, etc. is estimated at $350 billion (excluding investment services of banks and insurances companies) [1]. This represents nearly 3% of all US GDP a year! Some intermediation is obviously essential, but if we consider the management fees that actively managed products require, the costs related to excessive trading activity and the significant distribution costs of many financial products, it could be shown that unnecessary intermediation is reducing the wealth of all investors (or is transferring this wealth to a small select group) by 15% in present value terms, possibly more. Excessive intermediation could even become a drag on the overall economy. As investors, we have to make better decisions than just betting on which active manager will be the next winner, and whether or not there is such a thing as a reliable coin-tossing expert. Furthermore, investors cannot necessarily rely on advisors for that purpose, because advisors are often biased in favor of offering the most recent winners, and thus are not always objective or often knowledgeable enough to make an informed recommendation. There are obviously exceptions, but this is often true.
Therefore, the purpose of this first chapter is not to determine if we can identify managers or strategies that can outperform the market. It is simply to make the argument that more than half, perhaps two-thirds, of assets being managed will underperform whatever the asset category or investment horizon. Finally, although the discussions in Chapter 1 are sometimes supported by the finance literature related to individual investors, who often pay significantly higher management fees than institutional investors, the investment principles that are presented, the questions that are raised and the implications of our assumptions are relevant to both individual and institutional investors.
Understanding Active Management
Active management is a complex issue. We want to believe that our financial advisor can identify skilled managers, or that we are skilled managers. We buy actively managed products because we hope the management fees that are being paid to investment professionals will help us outperform the market and our peers. However, before we even address the particularities of active managers' performances and skills, we have to realize that active management is globally a negative-sum game. It basically means that even before we have hired a manager, our likelihood of outperforming the market by investing in an actively managed product is almost always much less than 50%. Why is that?
First, we live in a world where the market value of all assets within a financial market is simply the sum of the market value of all single securities in that market. For example, the market value of the large-capitalization (large-cap for short) equity segment in the United States is equal to the sum of the market value of every single security in that particular segment (i.e., Exxon, IBM, Johnson & Johnson, etc.). This is true of all financial markets, whether they are categorized according to asset classes (equities and fixed income), size (large capitalization, small capitalization, etc.), sectors (financial, industrial, etc.), style (growth, value) or country (United States, Canada, etc.). Second, all of these securities have to be owned directly or indirectly by investors at any moment in time, whether these investors are institutions such as pension funds and endowment funds, corporations such as life insurance companies, hedge funds, mutual funds, individuals or even governments or government-related entities. Even central banks are investors. Investors as a group collectively own the market. What is the implication of this for active management?
To illustrate, we will use a simple example. We will assume an equity market is only comprised of the securities of two companies, X and Y. However, the conclusion would be the same if there were 1,000 or 10,000 securities. The first company, X, has a market value of $600 million, while the second company, Y, has a market value of $400 million. Thus, the entire value of the market is $1 billion. Consequently, X accounts for 60% of the value of the entire market, and Y the other 40%. Now, let's assume the returns on the shares of each company are respectively 30% and 0% during the following year. What will be the weight of each company in the market?
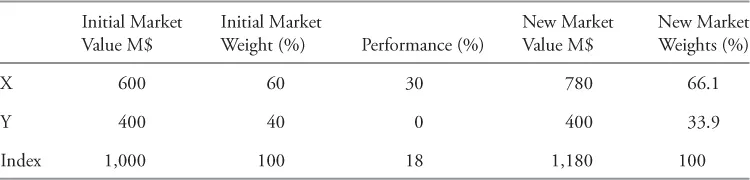
After one year, X is worth $780 million, while Y is still worth $400 million. The market value of both companies, and thus of the entire market, is now $1,18 billion (+18%), and their respective market weights are now 66.1% (780/1,180) and 33.9% (400/1,180). This is illustrated in Table 1.1.
Table 1.1 The Structure of a Hypothetical Equity Market
In this example, the entire value of the market is initially $1,000 million, while it is $1,18 billion one period later. The performance of the market was 18%. Who owns this market? As we already indicated, it is owned by all investors, either directly or indirectly (through products such as mutual funds).
Let's assume that among all investors, some investors are passive investors who are indexed to this market. This means they are not betting on which security (X or Y) will perform better. They are perfectly content to invest in each company according to the same proportion as in the overall market. Their initial investment was $300 million, or 30% of the entire market. What was the performance of these passive investors? It was 18% before fees, the same as the market. If passive investors realized an 18% return, what was the aggregate performance of all active investors that owned the other $700 million in securities, or 70% of this market? It had to be 18% in aggregate before fees for all active investors, or the same as passive investors. It cannot be otherwise. Once we have removed the assets of all indexed investors who received a performance equivalent to the market, what we have left are the collective assets of all active investors who must share a performance equal to the market. It is that simple.
Of course, some active managers will outperform the market, but if the aggregate performance of active managers is the same as that of the market, some will have to underperform. To simplify further, let's assume there are only two active investors, each with an initial investment of $350 million. If an active manager realizes a performance of 21%, or 3% above the market because he had a 70% allocation to X and 30% to Y (70% ∞ 30% + 30% ∞ 0% = 21%), the other active manager has to have a performance of 15%, or 3% below the market, and he must have had a 50% allocation to X and 50% to Y (50% ∞ 30% + 50% ∞ 0% = 15%). Again, it cannot be otherwise since the positions held by all investors are equal to the total positions available in the market, and the sum of the aggregate performance of all active and passive managers alike cannot be more than the performance of the market. It must be equal.
Now, let's imagine there are thousands of active managers out there. Since the sum of their aggregate performance cannot be more than that of the market, we can safely assume that investors and managers that represent 50% of all money invested actively in a market will underperform that market, and investors and managers that represent 50% of all money invested actively in a market will outperform that market. It cannot be otherwise. Therefore, we have shown that active management is, at most, a zero-sum game. It simply redistributes existing wealth among investors, whether individual or institutional.
When I mention that active management is a negative-sum game and not a zero-sum game, it is because of fees: management fees, advisory fees, trading fees, etc. In aggregate, active and passive managers alike will not realize the performance of the market because they both pay fees, although fees for active management can be significantly higher. In the previous example, if the average of all fees paid by investors is 1.0%, the aggregate performance of all investors net of fees will only be 17.0%. The performance drain could be slightly less, since investors could recuperate part of this wealth transfer through their ownership of the financial sector, but it could only amount to a small fraction of the drain. Thus, the greater the fees paid to advisors, the lower the probability that investors can match or outperform the market.
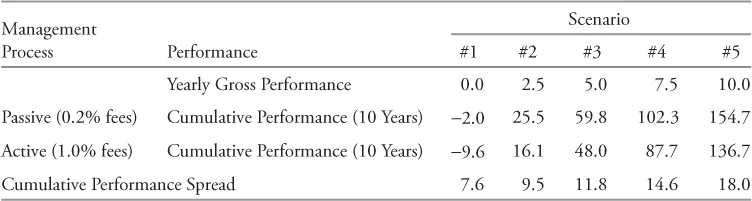
To illustrate further, let's assume an investor has a choice between two products to invest in the US large-capitalization equity market. One product, which is indexed to the market, is relatively cheap. The total expenses related to this product are 0.2% yearly. The second product, an actively managed product, is more expensive. Its total expenses are 1.0% per year. Thus, in order for this investor to achieve a higher performance with the actively managed product, the active manager must outperform the indexed product by about 0.8% per year (assuming the index product is an accurate representation of the market), and this must be done in a world where all active investors in aggregate will do no better than the market return before fees. If 0.8% in fees per year does not seem so important, maybe you should consider their impact on a 10-year horizon using some assumptions about market returns. Table 1.2 shows the cumulative excess performance (above the market) required from an active manager over 10 years to outperform an indexed product when the difference in management fees is as specified, and when the gross market return is either 0%, 2.5%, 5%, 7.5% or 10% yearly.
Table 1.2 Impact of Fees on Cumulative Performance (%)
The example illustrates that the impact of fees on performance is not independent of market returns. The greater the market performance, the greater the cumulative excess performance required from an active manager to match the performance of a cheap index alternative, because investors not only pay fees on their initial capital, but also on their return. At a low 5% average annual return, the manager must outperform a cheap index product by 11.8% over 10 years. At 7.5% average annual market return, he must outperform by 14.6%. This requires a lot of confidence in your active manager, and what we have indicated about active management being a zero-sum game before fees is true for any investment horizon, one year, five years, ten years, etc. How likely is it that an active manager can outperform the market adjusted for fees over a long period of time, such as 10 years? It all depends on two factors. First, what is the level of fees, and second, what is the usual range of performance for all active managers against the market. For example, if all managers were requiring 1% yearly fees, we need to have some managers that outperform the market by at least 1% yearly on average (before fees) to be able to calculate a positive probability of outperforming the market. If not, the probability is nil.
Several studies have looked at this issue from different angles. Iwill initially reference only one study and come back with more evidence later. Rice and Strotman (2007) published very pertinent research about the fund-management industry [2]. Their research analyzed the performance profile of 1,596 mutual funds in 17 submarket segments over a 10-year time frame ending on December 31, 2006. The authors used the range of performance (before fees) observed for all managers against their respective markets over this period to estimate the likely probability of any manager outperforming the market in the next 10 year...