![]()
Chapter 1
Surveys and Business Surveys
Jacqui Jones, Ger Snijkers, and Gustav Haraldsen
1.1 The Objective of This Book
The objective of this book is to provide a coherent overview of designing and conducting business surveys. Using the generic statistical business process model (GSBPM) as a high-level framework, the book brings together what we currently know about planning, designing, and conducting business surveys, right through to producing and disseminating statistics or other research results from the collected data. This knowledge is accumulated from various disciplines such as survey methodology, organizational sciences, sociology, and psychology. The result is a multidisciplinary process-quality approach. The contents of the book reflect the existing literature (books, journal articles, conference papers, etc.) and the experiences and observations of the authors. The book is intended to help anyone involved in designing and/or conducting business surveys, producing statistics or other research results from business surveys, or using statistics produced from business surveys; and open up new areas for future business survey research.
Businesses are central to a country's economy in terms of both economic growth and maintaining the nation's infrastructure. Because of their importance, data from businesses are needed for national, regional, local, and individual business monitoring, and policymaking and decisionmaking, as well as decisionmaking for individual members of society. The required data may relate, for example, to the economic performance of businesses, business perceptions of current and future performance, or working practices, policies, or conditions.
Business surveys are one method for collecting data from businesses, which are organizations involved in the production and/or trade of goods and/or services. In some respects the methods used to design, build, collect, and process a business survey are the same as those used in surveys of individuals and households. A sample frame is required; a sample is designed and selected; data are collected; various communication methods are used to elicit contact and cooperation with respondents; the collected data need to be captured, coded, and cleaned; and the survey methods need to focus on minimizing errors, response burden, and building trust. Yet, underlying these high-level processes are unique features relevant only to business surveys.
Cox and Chinnappa (1995) note that there is no generally accepted definition of a business and they use an expanded approach including businesses (e.g., manufacturing, construction, retail, financial organizations), farms (e.g., crop, livestock, vineyards) and institutions (e.g., schools, hospitals, prisons) (ibid., p. 3). Although this book focuses on surveying businesses, the methodologies, procedures, and practices described can be applied to surveying farms and institutions.
A business can also be defined from a national accounts perspective, where the focus is on institutional units that must be capable of “owning assets, incurring liabilities and engaging with economic activities and in transactions with other entities” (United Nations2008, p. 61). Businesses can be privately owned profit or not-for-profit organizations, state-owned not-for-profit, or a hybrid of private and state-owned.
This book is intended as a “how to” handbook covering the end-to-end business survey process set, in the context of the statistical production process. It is not, however, a cookbook type treatise; there is no standard recipe for designing and conducting a business survey. Every survey has its own special features that are relevant to the overall statistical production process. For every phase in the business survey process this book provides guidelines that facilitate educated tradeoff decisions in order to minimize survey errors, costs, and response burden.
This chapter is divided into three main parts: Sections 1.2 and 1.3, Sections 1.4–1.7, and Section 1.8. These are followed by an appendix outlining the history of UK official business statistics. In Section 1.2, we discuss the statistical production process; in Section 1.3, surveys in general and the survey process, with a brief historical overview of surveys in Section 1.3.3; in Section 1.4, types of business data outputs; in Section 1.5, how business data outputs are used; in Section 1.6, obtaining business data; and in Section 1.7, business surveys. In Section 1.7.2.1, we discuss business survey constraints and considerations, with resulting unique features of business surveys. These features are discussed further throughout the book. Section 1.8, outlines the organization of the book and summarizes the topics discussed in each chapter (see Section 1.8.3).
1.2 The Statistical Production Process
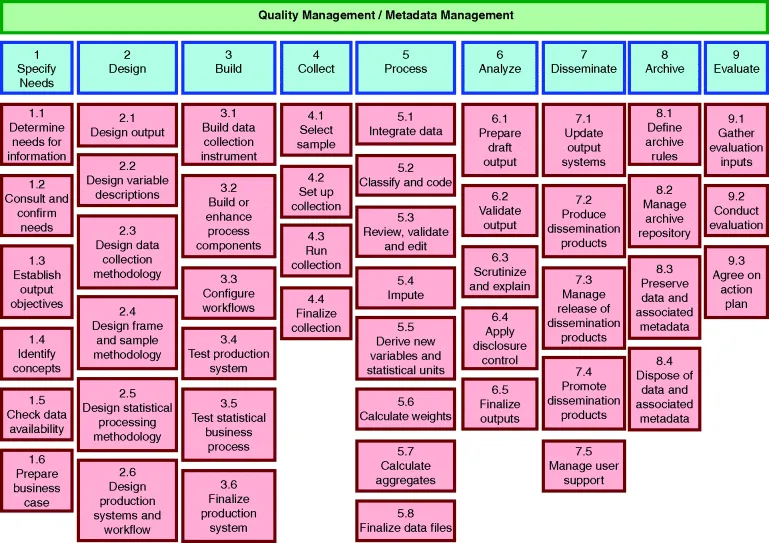
The generic statistical business process model (GSBPM) (Vale 2009) (Figure 1.1) provides a useful overview of the required phases and subprocesses for producing statistical outputs from any type of source; it can also be applied to the development and maintenance of statistical registers. Having a model helps define and describe statistical processes in a coherent way. It should also assist with standardizing terminology and comparing, benchmarking, and identifying synergies within and between organizations. The GSBPM was originally based on the business process model developed by Statistics New Zealand, and two additional phases (archive and evaluate) were added from reviewing models used in other national statistical institutes (NSIs). Originally it was seen as a vehicle for developing statistical metadata and processes (Vale 2010). The GSBPM identifies the phases in producing statistics independent of data sources (e.g., surveys, censuses, administrative sources, register-based statistics, mixed sources), and acknowledges that the order of phases will vary between the production of individual statistical outputs. There are four levels in the GSBPM (Vale 2009):
Level 0: the statistical business process
Level 1: the nine phases of the statistical business process
Level 2: the subprocesses within each phase
Level 3: a description of those subprocesses
In addition to the GSBPM phases and processes highlighted in Figure 1.1, there are 12 overarching themes (see Section 4.6), although only the first two themes are represented in Figure 1.1 (quality management and metadata management). These 12 themes need to be considered and strategies implemented to manage the numerous aspects of the statistical production process. What is evident here is the importance of planning and managing the whole statistical production process (see Chapters 4 and 10).
In this book the GSBPM is used as the high-level framework for the organization of the chapters, but with additional focus on the survey process phases required to collect and process business data.
1.3 Surveys
1.3.1 Definition of Surveys
Surveys typically collect data from a subset of the population of interest; if the population is appropriately sampled, the results are generalizable to the population. This is not as easy as it seems and is challenging from a number of perspectives, for example, selecting a sample representative of the population of interest, selecting appropriate data collection modes, designing questions and questionnaires that will collect the required data and that respondents can successfully complete, developing and implementing strategies for improving response, and quality-assuring and cleaning the collected data.
To meet known data needs, surveys can provide timely data using specific survey questions. Surveys can collect a variety of different types of data, for example, factual data (e.g., date that the business started), monitoring data (e.g., the amount of money invested in capital), attitudinal data (e.g., attitudes toward government's economic policy), and/or perception data (e.g., perception of the business' performance). However, the type of data collected can impact on key characteristics of the survey design. Such as design of the data collection instrument, the mode of data collection, and how the data are validated. Surveys can also provide better control of processing and coverage errors (Lavallée 2002).
A survey is a method of collecting quantitative data from a sample of the population of interest. In some cases qualitative data, from responses to open-ended questions, may be collected but will be coded during the processing phase to produce quantitative results. Groves (1989) acknowledges that the term survey is not well defined, as does De Leeuw et al. (2008), who found differing definitions, with some definitions defining surveys by the “major components of surveys and survey error.” From a review of the literature, De Leeuw et al. (ibid, p.2) identified the common characteristics of existing survey definitions and description stating that “a survey can be seen as a research strategy in which quantitative information is systematically collected from a relatively large sample taken from a population.” The survey outputs are statistics; “quantitative descriptors” (Groves et al. 2004, p. 2).
In Section 1.2 we described the GSBPM as providing an overview of the statistical production process regardless of source (e.g., survey or existing source); what is not evident are the key components of the surveys process. What distinguishes the production of statistical outputs from survey data, in comparison to, say, using administrative data, is essentially the fact that the survey components (sample frame; sample; questions and questionnaire; survey communication; and data capture, coding, and estimation) need to be designed, built, and tested, and then the data collected and processed, within the context of predefined statistical research purposes. This is in contrast to existing data sources where the data have already been requested, collected and processed, aimed at administrative use of the data, and ‘organic’ data that are generated automatically within processes (like traffic loop data, mobile phone and GPS data, scanner data on purchases (Groves, 2011)). Table 1.1 shows the distinguishing characteristics of the survey process set in the context of the GSBPM.
Table 1.1 Distinguishing Characteristics of the Survey Process Set in the Context of the GSBPM.
| Whom you need to request data from (sample frame and sample). | Select sample. | |
| How you will request and collect the data (survey communication, questions and questionnaire, and mode). | Request and collect the data. | |
| For recurring surveys with panel or overlapping sample designs, how you will build and maintain respondent relations. | Implement questionnaires, and survey communication, taking recurring contacts into account. | |
| How you will process the data (data capture, coding, editing and imputation). | Initial data capture into the data collection instrument. Data transfer to the survey organization. | Data capture processing, coding and cleaning. |
| How you will use the survey data to provide estimates of the population of interest. | | Estimate to the population. |
| How you will minimize, measure, and monitor sampling and nonsampling errors, costs, and actual and perceived response burden; trust in the survey organization and the produced outputs are also linked to this characteristic. | Implement quality and process management to minimize and measure sampling and nonsampling errors, costs, and actual and perceivd response burden. | Implement quality and process management. |
Once collected and processed the survey data are used to produce statistical outputs. The survey process and statistical production process therefore comprise several phases, which all need to be planned, designed, and tested to run a successful survey and produce fit for purpose outputs.
1.3.2 Survey Constraints, Considerations, and Tradeoffs
When designing and conducting a survey, you will be faced with constraints and consideration relating to: (1) the survey project, including financial resources, relevant expertise, time, and the production environment (see Chapter 4); and (2) the design and conduct of the survey, including survey errors (see Chapter 3), response burden (see Chapter 6), and trust. Undoubtedly these constraints and considerations will lead to tradeoff decisions (i.e., the tradeoff between, e.g., timeliness and accuracy).
1.3.2.1 Survey Errors and the Process Quality Approach
Groves (1989, p. 35) states that “survey estimates are subject to many sources of error” and categorizes these errors as nonobservation (coverage, sample, and nonresponse) and observations errors (construct and measurement). The ultimate concern is that potential errors be recognized and factored into the design and conduct of surveys, as they ultimately can affect the quality of the survey outputs. For example, if the sampling frame has missing units, then this will affect the quality of the statistics; if the questions are not comprehended as intended, different data will be collected. In 2004 (Groves et al. 2004, p. 48) related these errors to the survey process: “good survey estimates require simultaneous and coordinated attention to the different steps in the survey process.” In this book we will take the same process quality perspective. Chapter 3 provides a detailed discussion of total survey error in the context of the business survey process, integrating quality perspectives related to the survey design, the survey organization, and users.
1.3.2.2 Response Burden
Response burden is multidimensional and includes actual and perceived response burden. Traditionally response burden has been regarded as the time spent responding to the survey (actual burden). But this economic cost is not the only consideration. Perceptions of burden are also significant, as these perceptions can impact the quality of collected data. For example, respondents who perceive the topic of the survey as uninteresting and/or irr...