![]()
CHAPTER 1
IMPROVING SURVEYS WITH PARADATA: INTRODUCTION
FRAUKE KREUTER
University of Maryland and IAB/LMU
1.1 INTRODUCTION
Good quality survey data are hard to come by. Errors in creating proper representation of the population and errors in measurement can threaten the final survey estimates. Survey methodologists work to improve survey questions, data entry interfaces, frame coverage, sampling procedures, respondent recruitment, data collection, data editing, weighting adjustment procedures, and many other elements in the survey data production process to reduce or prevent errors. To study errors associated with different steps in the survey production process, researchers have used experiments, benchmark data, or simulation techniques as well as more qualitative methods, such as cognitive interviewing or focus groups. The analytic use of paradata now offers an additional tool in the survey researcher's tool box to study survey errors and survey costs. The production of survey data is a process that involves many actors, who often must make real time decisions informed by observations from the ongoing data collection process. What observations are used for decision making and how those decisions are made are currently often outside the researchers’ direct control. A few examples: Address listers walk or drive around neighborhoods, making decisions about the inclusion or exclusion of certain housing units based on their perceptions of the housing and neighborhood characteristics. Field managers use personal experience and subjective judgment to instruct interviewers to intensify or reduce their efforts on specific cases. Interviewers approach households and conduct interviews in idiosyncratic ways; doing so they might use observations about the sampled households to tailor their approaches. Respondents answer survey questions in settings unknown to the researcher but which affect their responses; they might be interrupted when answering a web survey, or other family members might join the conversation the respondent is having with the interviewer. Wouldn't we like to have a bird’s eye view to know what was going on in each of these situations? What information does a particularly successful field manager use when assigning cases? Which strategy do particularly successful interviewers use when recruiting respondents? What struggles does a respondent have when answering a survey question? With this knowledge we could tweak the data collection process or analyze the data differently. Of course, we could ask each and every one of these actors involved, but aside from the costs of doing so, much of what is going on is not necessarily a conscious process, and might not be stored in a way that it can be easily recalled (Tourangeau et al., 2000).
At the turn of the twenty-first century much of this process information became available, generated as a by-product of computer-assisted data collection. Mick Couper referred to these data as “paradata” in a presentation at the Joint Statistical Meeting in Dallas (Couper, 1998). Respondents in web surveys leave electronic traces as they answer survey questions, captured through their keystrokes and mouse clicks. In telephone surveys, automated call scheduling systems record the date and time of every call. In face-to-face surveys, interviewers’ keystrokes are easily captured alongside the interview and so are audio or even video recordings of the respondent--interviewer interactions. Each of these is an example of paradata available through the computerized survey software.
Some survey organizations have collected such information about the data collection process long before the rise of computer-assisted interviewing and the invention of the word paradata. However, a rapid growth in the collection and use of paradata can be seen in recent years (Scheuren, 2005). It is facilitated first, by the increase in computer-aided data collection around the world, second, by the increasing ease with which paradata are accessed, and third, by an increasing interest among survey sponsors in process quality and the quantification of process errors. Thus, while process quality and paradata are not new, a more structured approach in choosing, measuring, and analyzing key process variables is indeed a recent development (Couper and Lyberg, 2005). This book takes this structured approach and provides a summary of what we know to date about how paradata should be collected and used to improve survey quality, in addition to introducing new research results.
The chapters in the first part of this book review the current use of paradata and make general suggestions about paradata design principles. The second section includes several case studies for the use of paradata in survey production, either concurrently or through post hoc evaluations of production features. Chapters in the last section discuss challenges involved in the collection and use of paradata, including the collection of paradata in web surveys.
Before reading the individual book chapters, it is helpful to discuss some common definitions and to gain an overview of the framework that shaped the structure of this book and the write-up of the individual chapters.
1.2 PARADATA AND METADATA
There is no standard definition in the literature of what constitutes paradata. Papers discussing paradata vary in terminology from one to another (Scheuren, 2000; Couper and Lyberg, 2005; Scheuren, 2005; O’Reilly, 2009), but for the purpose of the book we define paradata as additional data that can be captured during the process of producing a survey statistic. Those data can be captured at all stages of the survey process and with very different granularities. For example, response times can be captured for sets of questions, one question and answer sequence, or just for the answer process itself.
There is some debate in the literature over how paradata differ from metadata. Metadata are often described as data about data, which seems to greatly overlap with our working definition of paradata. Let us step back for a moment and consider an analogy to digital photography which may make the paradata--metadata distinction clearer. Digital information such as the time and day a picture was taken is often automatically added by cameras to the file. Similarly, the lens and exposure time and other settings that were used can be added to the file by the photographer. In the IT setting, this information is called metadata or data about data.
Paradata are instead data about the process of generating the final product, the photograph or the survey dataset. In the photography example, the analogy to paradata would be data that capture which lenses were tried before the final picture was taken, information about different angles the photographer tried before producing the final shot, and the words she called out before she was able to make the subject smile.
In the digital world, metadata have been a common concept for quite a while. In the social sciences, the interest in metadata is newer but heavily promoted through efforts like the Data Documentation Initiative or DDI (http://www.ddialliance.org/), which is a collaboration between European and U.S. researchers to develop standards for social science data documentation. Metadata are the core of this documentation and can be seen as macro-level information about survey data; examples are information about the sampling frame, sampling methods, variable labels, value labels, percentage of missing data for a particular variable, or the question text in all languages used for the survey. Metadata allow users to understand the structure of a dataset and can inform analysis decisions.
Paradata capture information about the data collection process on a more micro-level. Some of this information forms metadata if aggregated, for example, the response rate for a survey (a piece of metadata) is an aggregated value across the case-level final result codes. Or, using the examples given above, time measurements could be aggregated up to become metadata. Paradata that capture the minutes needed to interview each respondent or even the seconds it took to administer a single question within the survey would become the metadata information on the average time it took to administer the survey.
1.3 AUXILIARY DATA AND PARADATA
Paradata are not the only source of additional data used in survey research to enrich final datasets and estimates. Researchers also use what they call ‘auxiliary data’, but the definition of this term has not quite been settled upon. The keyword auxiliary data has been used to encompass all data outside of the actual survey data itself, which would make all paradata also auxiliary data. Also contained under auxiliary data are variables from the sampling frame and data that can be linked from other sources. The other sources are often from the Census or American Community Survey, or other government agencies and private data collectors. They are typically available on a higher aggregate level than the individual sampling unit, for example, city blocks or block groups or tracts used for Census reports or voting registries. Unlike paradata, they tend to be fixed for a given sampling unit and available outside of the actual data collection process. A typical example would be the proportion of minority households in a given neighborhood or block according to the last Census.
Paradata, as we define them here, are not available prior to data collection but generated within, and they can change over the course of the data collection. A good example is interviewer experience within the survey. If the sequence of contact attempts is analyzed and interviewer experience is added to the model, it would form a time varying covariate, for the experience changes with every case the interviewer worked on. Data on interviewer demographic characteristics are not always easily classified as either paradata or auxiliary variables. Technically, those data collected outside the survey are auxiliary data that can be merged to the survey data. However, if we think of the process of recruiting respondents, there might be changes throughout the survey in which cases are re-assigned to different interviewers, so the characteristics associated with the case (which include interviewer characteristics) might change because the interviewer changes.
A large set of different auxiliary data sources available for survey researchers was discussed at the 2011 International Nonresponse Workshop (Smith, 2011), where paradata were seen as one of many sources of auxiliary data. In the context of this book, we focus on paradata, because compared to other auxiliary data sources, their collection and use is more likely under the control of survey practitioners.
1.4 PARADATA IN THE TOTAL SURVEY ERROR FRAMEWORK
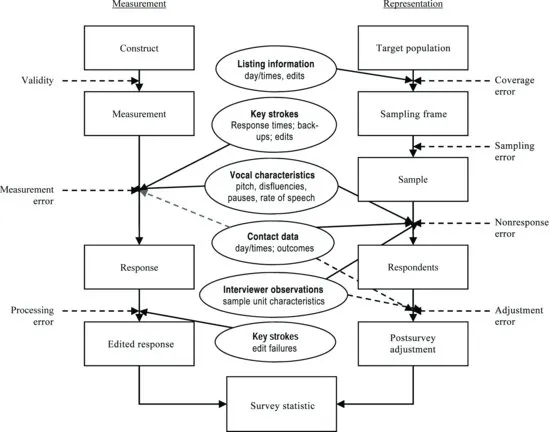
Paradata can help researchers understand and improve survey data. When we think about the quality of survey data, or more specifically a resulting survey statistic, the Total Survey Error Framework is a helpful tool. Groves et al. (2004) visualized the data collection process in two strands, one reflecting steps necessary for representation, the other steps necessary for measurement (see Figure 1.1). Each of the steps carries the risk of errors. When creating a sampling frame, there is a chance to miss some members of the population or to include those that do not belong, both of which can lead to coverage error. Sampling errors refer to the imprecision resulting from surveying only a sample instead of the population, usually reflected in standard error estimates. If selected cases refuse to participate in the survey, methodologists talk about nonresponse error, and any failure to adjust properly for such selection processes will result in adjustment error. On the measurement side, if questions fail to reflect the underlying concepts of interest, they suffer from low validity. Even when questions perfectly measure what is of interest to the researcher, failures can occur in the response process, leading to measurement error. Survey production often includes a phase of editing involving important consistency checks, and things can go wrong at this step too. Paradata can inform researchers about such errors that can happen along the way. In some instances, they can point to problems that can be solved during data collection; in other instances, paradata capture the information needed to model the errors alongside the actual survey data. Figure 1.1 depicts, within the survey data production process and the associated survey errors, some examples of paradata that are either collected at the respective steps (marked with a solid arrow) or used to evaluate a given error source (marked with a dashed arrow).
The chapters in the first section of this book are designed to introduce paradata within the Total Survey Error Framework. So far, paradata related to nonresponse are featured most prominently in the survey literature. The findings in these areas are discussed in detail by Frauke Kreuter, Kristen Olson, Bryan Packhurst, and Ting Yan. Paradata which inform us about coverage error are of increasing interest in a world with multiple frame creation methods, and are discussed by Stephanie Eckman. Unfortunately, the literature on paradata to inform data processing and related errors is very sparse so far. Thus, there is no chapter addressing this error source, though the general logic of designing and capturing paradata for the other error sources applies here too. Sampling errors and adjustment errors have been widely discussed in the literature, but as with coverage error, much less is done in terms of evaluating the process of sampling or adjustment through paradata. The same holds for the issue of validity, though one could imagine process information about questionnaire creation.
1.5 PARADATA IN SURVEY PRODUCTION
Paradata are not just used to evaluate survey errors after data collection is done. In some instances, paradata are available during data collection and can be used to monitor and inform the collection process in (almost) real time. Survey methodologists have started to explore using paradata to guide data collection procedures, a process called responsive or adaptive design. The chapter by Nicole Kirgis and James Lepkowski shares experiences using such an approach in the National Survey of Family Growth. Similar in spirit is the use of paradata to predict responses to within-survey requests, suggested by Joseph Sakshaug in Chapter 8. James Wagner reports paradata-driven experiments he carried out to try to increase response rates in both telephone and face-to-face surveys.
In order to monitor incoming data and to make useful design decisions, the field needs tools that display and summarize the large amount of incoming information. Some survey organizations, including the U.S. Census Bureau, have applied theories and methods from the quality control literature to their survey processes. These efforts are summarized in Chapter 9 by Matt Jans, Roby ...