This timely book presents new research results on high-energy particle physics related to solar flares, covering the theory and applications of the reconnection process in a clear and comprehensible way. It investigates particle kinetics and dynamics in flaring atmospheres and their diagnostics from spectral observations, while providing an analysis of the observation data and techniques and comparing various models. Written by an internationally acclaimed expert, this is vital reading for all solar, astro-, and plasma physicists working in the field.
Trusted by 375,005 students
Access to over 1.5 million titles for a fair monthly price.
Recent progress in hard X-ray (HXR) observations with RHESSI of light curves in numerous energy bands (Lin et al., 2002), in combination with advanced imaging (Hurford et al., 2002) and inversion techniques (Kontar et al., 2011), allows us to reconsider the current models of particle acceleration and the effect of their transport on observational characteristics.
1.2 Hard X-Ray Light Curves and Spectra
1.2.1 Light Curves
Spatially integrated HXR light curves obtained by RHESSI confirm many of the temporal features established by previous observations: sharp increases (bursts) of HXR intensity over a relatively short (~ 0.5–5 s) time scale accompanied by a more slowly varying component with a time scale of up to a few tens of minutes (Holman et al., 2011).
The appearance of both sharp HXR bursts and steady increases in HXR intensity suggests that electrons are accelerated on two fundamentally distinct time scales: a rapid acceleration to high, bremsstrahlung-emitting energies and a more stationary process that maintains the high-energy electron flux to produce steady HXR emission for a substantial fraction of an hour or even longer.
At lower photon energies
, where thermal bremsstrahlung dominates the total emission, emission at higher photon energies is weighted more heavily by plasma at high temperatures T. As a result, the decrease in conductive cooling time with temperature (τ ~ T−5/2) leads to emissions at higher energies peaking sooner (Aschwanden, 2007), and hence the light curve’s peaking progressively earlier with an increase in photon energy. At higher energies, where nonthermal bremsstrahlung dominates, the relative timing of the emission at different energies depends on both the reduced “time of flight” for higher-energy electrons before they impact upon the thick target of the lower atmosphere (which tends to advance high-energy emissions relative to low-energy ones; Aschwanden and Schwartz, 1996; Brown et al., 1998) and upon the decrease in collision frequency with energy (which tends to delay high-energy emissions relative to low-energy ones – Aschwanden et al., 1997).
1.2.2 Photon and Electron Energy Spectra
HXR emission during flares typically shows a very steep spectrum at lower energies
~ 10 keV, indicative of a thermal process. It must be noted, however, that the frequent assumption (Hurford et al., 2003a) of an isothermal plasma is neither expected on the basis of simple physics nor required by observations (e.g., Brown, 1974). Indeed, Aschwanden (2007) has shown that the assumption of an isothermal source is inconsistent with the observations of temporal variations of the HXR spectrum in flares observed by RHESSI.
At higher energies, the spectrum tends to flatten to a roughly power-law form, with a spectral index γ typically in the range ~ 3–5. There is evidence for spectral flattening at higher energies ~ 500–1000 keV, likely due to the increasing contribution of electron–electron bremsstrahlung (Kontar et al., 2007). Sometimes, for the most energetic flares, there is noticeable emission up to a few hundred megaelectronvolts (Hurford et al., 2006; Kuznetsov et al., 2006). In most powerful flares the photon spectra reveal double power laws with the spectral indices below ~ 30–60 keV being smaller (flatter) than those above this energy by 2–4 units (Grigis and Benz, 2006; Krucker et al., 2008a).
RHESSI observations reveal a relationship between spectral hardness and time. Values of the “local” spectral index γ(
) = −dlogI(
)/dlog
are generally lowest around the peak of the event – a so-called “soft-hard-soft” evolution (Fletcher and Hudson, 2002; Grigis and Benz, 2008), but the decrease before and increase after this time do not occur at the same rate for all
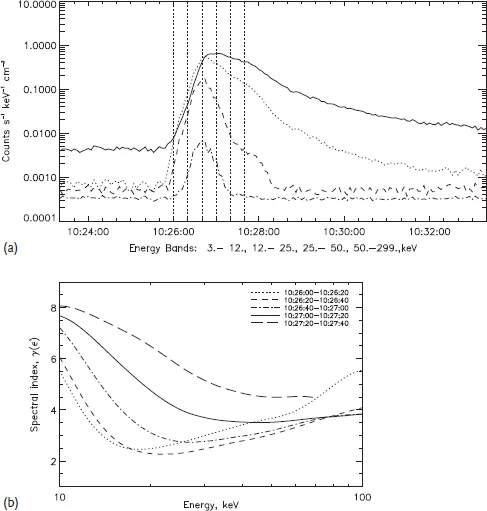
(see Figure 1.1 from Kontar and MacKinnon, 2005). A flare typically starts with a spectral index γ that is strongly dependent on energy, with the minimum value of γ showing a tendency to grow with time.
Figure 1.1 (a) Temporal variation (4 s cadence) of count rates in seven front RHESSI segments for the 26 February 2002 solar flare (10:26 UT). The vertical lines show five 20 s accumulation intervals for spectral analysis. (b) Temporal variation of energy-dependent photon spectral index γ(
) = −dlogI(
)/dlog
. Each line corresponds to one time interval.
From Kontar and MacKinnon (2005).
Nonthermal emission in the corona is identified in the impulsive phase by its softer spectrum (Mariska and McTiernan, 1999; Petrosian et al., 2002), consistent with the small column depth of the coronal part of the source. The absence of a significant amount of (energy-dependent) collisional losses in this relatively thin target should result in a spectrum two powers steeper than the target-averaged spectrum (Brown, 1971; Datlowe and Lin, 1973; Hudson, 1972).
It should be noted that even if the accelerated electrons have a power-law energy spectrum
, characteristic energies associated with either the electron transport or the radiation physics may produce deviations from the power-law behavior in the observed spatially integrated photon spectrum. Further, as elaborated upon by Kontar et al. (2011), anisotropy in the mean electron distribution, combined with the intrinsic directivity of the bremsstrahlung emission process, produces an anisotropic distribution of primary photons. Compton backscattering of photons from the photosphere (“X-ray albedo”, Bai and Ramaty, 1978; Langer and Petrosian, 1977) not only influences the observed photon spectrum but also has a diagnostic potential for determining the electron angular distribution (Kontar and Brown, 2006).
1.2.3 Electron Numbers
As pointed out by, for example, Tandberg-Hanssen and Emslie (1988), the total injected electron flux depends critically on the value of the low-energy cutoff Ec. A brief discussion of this issue is in order. Historically, a low-energy cutoff Ec was assumed simply in order to keep the injected power
finite (e.g., Brown, 1971; Holman et al., 2003). To determine whether or not such a cutoff is actually required by observations, it is essential to adopt a nonparametric approach to interpreting the photon spectrum I(
) – that is, to infer from I(
) what range of mean electron source functions
(E) (Brown et al., 2003) allow a statistically acceptable fit to I(
). Kašparová et al. (2005a), in their analysis of the 20 August 2002 flare, have shown that a low-energy cutoff, or even a gap, in the mean source electron spectrum exists if the observed spectrum is considered as primary bremsstrahlung only; however, such cutoffs or gaps disappear if an albedo correction (for an isotropic primary source) is applied to the observed photon spectrum. Finally, Emslie et al. (2003) has shown that, when allowance is made for warm target effects in the electron energy loss rate, the injected electron energy
corresponding to a pure power-law photon spectrum can be finite even if no low-energy cutoff exists.
It appears, therefore, that the actual value of Ec, if one exists at all, should be below 10 keV. In view of the steep spectra commonly observed during flares, extending the spectrum to lower and lower energies requires an ever-increasing number of accelerated electrons, thus imposing even more significant constraints on the electron-acceleration mechanism in flares.
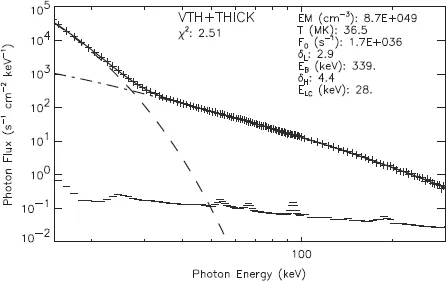
This having been said, electron fluxes deduced from observed photon spectra vary between 109 and 1012 erg cm−2 s−1. For example, Figure 1.2 shows the photon spectrum for the 28 October 2003 flare as recorded by RHESSI. Assuming that the nonthermal HXR emission is thick-target bremsstrahlung (Brown, 1971), one can straightforwardly derive the differential injected nonthermal electron flux (electrons s−1 keV−1) using a forward-fitting method (see Holman et al., 2003). For this event, one obtains a total nonthermal electron production rate of Fe = 1.7 × 1036 s−1, corresponding to an injected power of Pe = 1.5 × 1029 erg s−1. For a nominal flare area ~ 1017–1018 cm2, such a particle rate corresponds to a flux of Fe ~ 1019 cm2 s−1 and, hence, since the average electron velocity v ~ (c/3) ~ 1010 cm s−1, to a beam density of nb ~ 109 cm−3. This is a substantial fraction of the ambient density n ~ 1010 cm−3.
Figure 1.2 RHESSI HXR photon spectrum for solar event on 28 October 2003 (11:06:20–11:06:40 UT). The photon flux (plus signs) is fitted with a thermal bremsstrahlung contribution from an isothermal plasma (dashed curve) plus a double power-law nonthermal electron flux component with a low-energy cutoff (dashed–dotted curve). The best-fit parameters are shown in the plot.
The total electric current corresponding to such a particle acceleration rate, if the acceleration is unidirectional, is I ~ 3 × 10¹⁷ A, with a current density of j ~ 1 A cm −2. Such high current densities, especially since they are introduced over a time scale of seconds, produce unacceptably large inductive electric and magnetic fields, unless the acceleration is near-isotropic, as in stochastic acceleration models (Miller et al., 1996; Petrosian and Liu, 2004), the source has a very fine structure (Holman, 1985), or the beam current is effectively neutralized by a cospatial return current (see Brown and Bingham, 1984; Emslie, 1980; Knight and Sturrock, 1977; Larosa and Emslie, 1989; Zharkova and Gordovskyy, 2006; van den Oord, 1990).
Finally, it must be noted that replenishment within a short time scale of flares of the particles in an acceleration region (Emslie and Hénoux, 1995) has to be accounted for by any acceleration or transport mechanisms.
1.3 Light Curves and Energy Spectra of Gamma-Rays
1.3.1 γ-Ray Light Curves
Due to the limited sensitivities of GR detectors, information regarding short times scales for ion acceleration is less stringent than for the time scales of energetic electrons described in Section 2.1. Before the RHESSI launch, no detailed analysis had been performed systematically of the temporal profiles of prompt γ-ray line (GRL) emissions, although simultaneous peaking within ±1 s of the emission in the GRL domain and of HXR emission has been reported for a few events (e.g., Kane et al., 1986). This indicates that ion acceleration to a few megaelectronvolts must happen within a very short time scale of less than 1 s. It also indicates that in most cases the ions must interact with...
Table of contents
Cover
Half Title page
Title page
Copyright page
Preface
Chapter 1: Observational Phenomena of Solar Flares
Chapter 4: Electron Beam Precipitation – Fokker–Planck Approach
Chapter 5: Proton Beam Kinetics
Chapter 6: Hydrodynamic Response to Particle Injection
Chapter 7: Hard X-Ray Bremsstrahlung Emission and Polarization
Chapter 8: Microwave Emission and Polarization
Chapter 9: Langmuir Wave Generation by Electron Beams
Chapter 10: Nonthermal Hydrogen Emission Caused by Electron Beams
Chapter 11: Hα-Line Impact Polarization
Chapter 12: Sunquakes Associated with Solar Flares
Reference
Index
Frequently asked questions
Yes, you can cancel anytime from the Subscription tab in your account settings on the Perlego website. Your subscription will stay active until the end of your current billing period. Learn how to cancel your subscription
No, books cannot be downloaded as external files, such as PDFs, for use outside of Perlego. However, you can download books within the Perlego app for offline reading on mobile or tablet. Learn how to download books offline
Perlego offers two plans: Essential and Complete
Essential is ideal for learners and professionals who enjoy exploring a wide range of subjects. Access the Essential Library with 800,000+ trusted titles and best-sellers across business, personal growth, and the humanities. Includes unlimited reading time and Standard Read Aloud voice.
Complete: Perfect for advanced learners and researchers needing full, unrestricted access. Unlock 1.5M+ books across hundreds of subjects, including academic and specialized titles. The Complete Plan also includes advanced features like Premium Read Aloud and Research Assistant.
Both plans are available with monthly, semester, or annual billing cycles.
We are an online textbook subscription service, where you can get access to an entire online library for less than the price of a single book per month. With over 1.5 million books across 990+ topics, we’ve got you covered! Learn about our mission
Look out for the read-aloud symbol on your next book to see if you can listen to it. The read-aloud tool reads text aloud for you, highlighting the text as it is being read. You can pause it, speed it up and slow it down. Learn more about Read Aloud
Yes! You can use the Perlego app on both iOS and Android devices to read anytime, anywhere — even offline. Perfect for commutes or when you’re on the go. Please note we cannot support devices running on iOS 13 and Android 7 or earlier. Learn more about using the app
Yes, you can access Electron and Proton Kinetics and Dynamics in Flaring Atmospheres by Valentina Zharkova in PDF and/or ePUB format, as well as other popular books in Sciences physiques & Thermodynamique. We have over 1.5 million books available in our catalogue for you to explore.