![]()
Part One
The Basics
![]()
CHAPTER 1
Introduction
The investments arena is large, complex, and dynamic. These characteristics make it interesting to study, but also make it challenging to keep up. What changes? Laws and regulations, the introduction of new types of securities, innovations in markets and trading, company events (such as the passing of the CEO or a settlement of a lawsuit), and a persistently changing economy to name a few. Add to this mix the political, technological, and environmental changes that occur throughout the world every day, and you have quite a task to understand investment opportunities and investment management.
There is a wealth of financial information about companies available to financial analysts and investors. The popularity of the Internet as a source of information has made vast amounts of information available to everyone, displacing print as a means of communication. Consider the amount of information available about Microsoft Corporation. Not only can investors find annual reports, quarterly reports, press releases, and links to the companies' filings with regulators on Microsoft's web site, anyone can download data for analysis in spreadsheet form and can listen in on Microsoft's management's conversations with analysts.
The availability and convenience of information has eased the data-gathering task of financial analysis. What remains, however, is the more challenging task of analyzing this information in a meaningful way. Recent scandals involving financial disclosures increase the importance of knowing just how to interpret financial information. In response to these scandals, Congress passed the Sarbanes-Oxley (SOX) Act of 2002, which increases the responsibility of publicly traded corporations, accounting firms performing audits, company management, and financial analysts.1 And while this Act is an attempt to restore faith in financial disclosures, investors and analysts must still be diligent in interpreting financial data in a meaningful way.
This need for diligence is evident in the financial crisis of 2007–2008, which tested analysts' and investors' abilities to understand complex securities and their accounting representation. The Dodd-Frank Wall Street Reform and Consumer Protection Act (Dodd-Frank Act) passed in 2010 in response to the crisis, added requirements pertaining to corporate governance, security regulation, the regulation of the financial services industry, and consumer protections.2 And, while there will likely be additional disclosures of some of the more complex instruments as a result of this act, financial instruments are constantly evolving, and analysts and investors have to stay abreast of these innovations and their implications for analysis.
The purpose of this book is to assist the analyst and investor in understanding financial information and using this information in an effective manner.
WHAT IS FINANCIAL ANALYSIS?
Our focus in this book is on financial analysis, which is the selection, evaluation, and interpretation of financial data and other pertinent information to assist in evaluating the operating performance and financial condition of a company. The operating performance of a company is a measure of how well a company has used its resources—its assets, both tangible and intangible, to produce a return on its investment. The financial condition of a company is a measure of its ability to satisfy its obligations, such as the payment of interest on its debt in a timely manner.
Financial reporting is the collection and presentation of current and historical financial information of a company. This reporting includes the annual reports sent to shareholders, the filings with the Securities and Exchange Commission (SEC) for publicly traded companies, and press releases and other reports made by the company. Financial analysis takes that information—and much more—and makes sense out of it in terms of what it says about the company's past performance and condition and, more importantly, what it says about the company's future performance and condition.
The financial analyst must determine what information to analyze (e.g., financial reports, market information, economic information) and how much information (5 years? 10 years?) to review. The analyst must sift through the vast amount of information, selecting the information that is most important in assessing the company's current and future performance and condition. A part of this analysis requires the analyst to assess the quality of the information. Though publicly traded companies must report their financial information according to generally accepted accounting principles (GAAP), there is still some leeway that the reporting company has within these principles. The analyst must understand the extent of this leeway and what this implies for the company's future performance.
The analyst has many tools available in the analysis of financial information. These tools include financial ratio analysis and quantitative analysis. The key to analysis, however, is understanding how to use these tools in the most effective manner.
What happens if we're not looking closely at financial information? Lots. Several of the scandals that arose in the past few years were actually detectable using basic financial analysis and common sense. It is not possible to spot all cases of fraud and manipulation, but there are some telltale signs that should raise caution flags in analysis. Examples of these signs include:
- Revenue growth that is out of line with others in the same industry or not reasonable given the current economic climate.
- Profits that are increasing at a much faster rate than cash flows generated from operations.
- Debt disappearing from the balance sheet.
Example: Enron
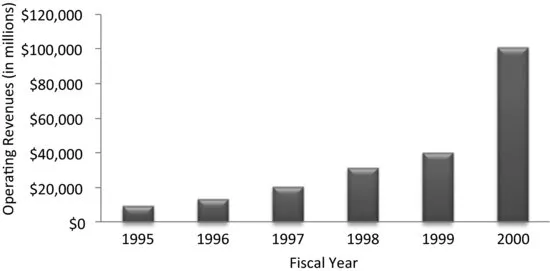
Consider Enron Corporation, which filed for bankruptcy in 2001 following a financial-reporting scandal. Enron's revenues grew from a little over $9.1 billion to over $100 billion in the 10-year period from 1995 through 2000 as we show in Exhibit 1.1; in other words, its revenues grew at an average rate of over 61% per year. During this period, Enron's debts grew too, from 76% of its assets to over 82% of its assets. Enron experienced significant growth and reported significant debt, becoming one of the largest corporations in the United States within 15 years of becoming a publicly traded corporation.
An interesting aspect of Enron's growth is that the company produced revenues far in excess of what other companies of similar size could produce. For example, in 2000, Enron produced over $5 million in revenues per employee, whereas Exxon Mobil could only produce $2 million per employee and General Electric only $0.4 million per employee.3
Enron became embroiled in an accounting scandal that involved, in part, removing debt from its balance sheet into special purpose entities. While the scandal proved shocking, Enron had actually provided information in its financial disclosur...