![]()
CHAPTER 1
Introduction
1.1 PRELIMINARIES
This book is written for biomedical researchers, epidemiologists, consulting statisticians, students taking a first course on survival data analysis, and others interested in survival time study. It deals with the statistical methods for analyzing survival data derived from laboratory studies of animals, clinical and epidemiologic studies of humans, and other appropriate applications.
Survival time can be broadly defined as the time to the occurrence of a given event. This event can be the development of a disease, response to a treatment, relapse, or death. Therefore, survival time can be tumor-free time, the time from the start of treatment to response, length of remission, and time to death. Survival data can include survival time, response to a given treatment, and patient characteristics related to response, survival, and the development of a disease. The study of survival data has focused on predicting the probability of response, survival, or mean lifetime, comparing the survival distributions of experimental animals or of human patients and the identification of risk and/or prognostic factors related to response, survival, and the development of a disease. In this book, special consideration is given to the study of survival data in biomedical sciences, though all the methods are suitable for applications in industrial reliability, social sciences and business. Examples of survival data in these fields are lifetime of electronic devices, components or systems (reliability engineering), felons’ time to parole (criminology), duration of first marriage (sociology), length of newspaper or magazine subscription (marketing) and workmen’s compensation claims (insurance), and their various influencing risk or prognostic factors.
1.2 CENSORED DATA
Many researchers consider survival data analysis to be merely the application of two conventional statistical methods to a special type of problem: parametric if the distribution of survival times is known to be normal and nonparametric if the distribution is unknown. This assumption would be true if the survival times of all the subjects were exact and known. However, some survival times are not. Further, the survival distribution is often skewed or far from being normal. Thus, there is a need for new statistical techniques. One of the most important developments is due to a special feature of survival data in the life sciences that occurs when some subjects in the study have not experienced the event of interest at the end of the study or time of analysis. For example, some patients may still be alive or disease-free at the end of the study period. The exact survival times of these subjects are unknown. These are called censored observations or censored times and can also occur when individuals are lost to follow-up after a period of study. When there are no censored observations, the set of survival times is complete. There are three types of censoring.
1.2.1 Type I Censoring
Animal studies usually start with a fixed number of animals, to which treatment or treatments are given. Because of time and/or cost limitations, the researcher often cannot wait for the event of interest to occur to all the animals. One option is to observe for a fixed period of time, say 6 months, after which the surviving animals are sacrificed. Survival times recorded for the animals that had the event during the study period are the times from the start of the experiment to the time the event occurred. These are called exact or uncensored observations. The survival times of the sacrificed animals are not exactly known, but are recorded as at least the length of the study period. These are called censored observations. Some animals could be lost or die accidentally. Their survival times, from the start of experiment to loss or death, are also censored observations. In type I censoring, if there are no accidental losses, all censored observations equal the length of the study period.
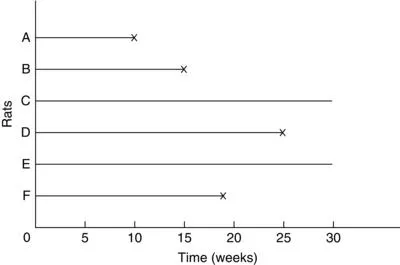
For example, suppose that six rats have been exposed to carcinogens by injecting tumor cells into their foot-pads. The times to develop a tumor of a given size are observed. The investigator decides to terminate the experiment after 30 weeks. Figure 1.1 plots the development times of the tumors. Rats A, B, and D develop tumors after 10, 15, and 25 weeks, respectively. Rats C and E do not develop tumors by the end of the study; their tumor-free times are thus 30+ weeks. Rat F died accidentally without any tumors after 19 weeks of observation. The survival data (tumor-free times) are 10, 15, 30+, 25, 30+, and 19+ weeks. (The plus indicates a censored observation.)
1.2.2 Type II Censoring
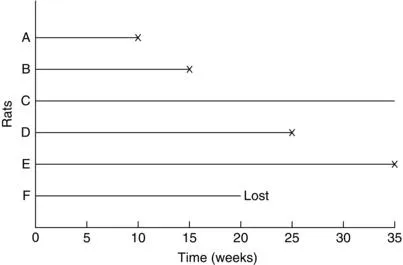
Another option in animal studies is to wait until a fixed portion of the animals have had the event of interest, say 80 of 100, after which the surviving animals are sacrificed. In this case, if there are no accidental losses, the censored observations equal the largest uncensored observation. For example, in an experiment of six rats (Figure 1.2), the investigator may decide to terminate the study after four of the six rats have developed tumors. The survival or tumor-free times are then 10, 15, 35+, 25, 35, and 19+ weeks.
1.2.3 Type III Censoring
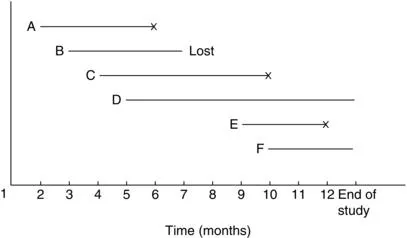
In most clinical and epidemiologic studies, the period of study is fixed and patients enter the study at different times during that period. Some may have the event before the end of the study; their exact survival times are known. Others may withdraw before the end of the study and are lost to follow-up. Still others may be alive at the end of the study. For “lost” persons, survival times are at least from their entrance to the last contact. For persons who still have no event, survival times are at least from entry to the end of the study. The latter two kinds of observations are censored observations. Since the entry times are not simultaneous, the censored times are also different. This is type III censoring. For example, suppose that six patients with acute leukemia enter a clinical study during a total study period of 1 year. Suppose also that all six respond to treatment and achieve remission. The remission times are plotted in Figure 1.3. Patients A, C, and E achieve remission at the beginning of the second, fourth, and ninth months, and relapse after four, six and three months, respectively. Patient B achieves remission at the beginning of the third month but is lost to follow-up four months later; the remission duration is thus at least four months. Patients D and F achieve remission at the beginning of the fifth and tenth months, respectively, and are still in remission at the end of the study; their remission times are thus at least eight and three months. The respective remission times of the six patients are 4, 4+, 6, 8+, 3, and 3+ months.
Type I and Type II censored observations are also called singly censored data and Type III progressively censored data. Another commonly used name for Type III censoring is random censoring. All of these types of censoring are right censoring or censoring to the right. There are also left censoring and interval censoring cases. Left censoring occurs when it is known that the event of interest occurred prior to a certain time, t, but the exact time of occurrence is unknown. For example, an epidemiologist wishes to know the age at diagnosis in a follow-up study of diabetic retinopathy. At the time of the examination, a 50-year-old participant was found to have already developed retinopathy but there is no record of the exact time at which initial evidence was found. Thus, the age at the examination, that is, 50, is a left censored observation. It means that the age of diagnosis for this patient is at most 50 years.
Interval censoring occurs when the event of interest is known to have occurred between times a and b. For example, if medical records indicate that at age 45, the patient in the aforementioned example did not have retinopathy, his age at diagnosis is between 45 and 50 years.
We will study descriptive and analytic methods for complete, singly censored, and progressively censored survival data using numerical and graphical techniques. Analytic methods discussed include parametric and nonparametric. Parametric approaches are used either when a suitable model or distribution is fitted to the data or when a distribution can be assumed for the population from which the sample is drawn. Commonly used survival distributions are the exponential, Weibull, lognormal, gamma, and log-logistic. If a survival distribution is found to fit the data properly, the survival pattern can then be described by the parameters in a compact way. Statistical inference can be based on the distribution chosen. If the search for an appropriate model or distribution is too time consuming or not economical or no theoretical distribution adequately fits the data, nonparametric methods, which are generally easy to apply, should be considered.
1.3 SCOPE OF THE BOOK
Chapters 1–3 define survival functions and gives examples of survival data analysis. Survival distribution is most commonly described by three functions: survivorship function (also called cumulative survival rate or survival function), probability density function, and hazard function (hazard rate or age-specific rate). Chapter 2 defines these three functions and their equivalence relationships. Chapter 3 illustrates survival data analysis with seven examples taken from actual research situations. Clinical and laboratory data are systematically analyzed in progressive steps and the results are interpreted. Section and chapter numbers are given for quick reference. The actual calculations are given as example or left as exercises in the chapters where the methods are discussed. Four sets of data are provided in the exercise section for the reader to analyze. These data are referred to subsequent chapters.
In Chapters 4 and 5 we introduce some of the most widely used nonparametric methods for estimating and comparing survival distributions. Chapter 4 deals with the nonparametric methods for estimating the three survival functions: the Kaplan and Meier product-limit (PL) estimate, the Nelson–Aalen estimate, and the life-table technique (population life tables and clinical life tables). Also covered is standardization of rates by direct and indirect methods including the standardized mortality or morbidity ratio (SMR). Chapter 5 is devoted to nonparametric techniques for comparing survival distributions. A common practice is to compare the survival experiences of two or more groups differing in their treatment or in a given characteristic. Several nonparametric tests are described.
Chapters 6–9 introduce the parametric approach to survival data analysis. Although nonparametric methods play an important role in survival studies, parametric techniques cannot be ignored. Chapter 6 introduces and discusses the exponential, Weibull, lognormal, gamma, and log-logistic survival distributions. Practical applications of these distributions taken from the literature are included.
An important part of survival data analysis is model or distribution fitting. Once an appropriate statistical model for survival time has been constructed and its parameters estimated, the information can help predict survival, develop optimal treatment regimens, plan future clinical or laboratory studies, and so on. Chapter 7 discusses the analytical estimation procedures for survival distributions. Most of the estimation procedures are based on the maximum likelihood method. Mathematical derivations are omitted; only formulas for the estimates and examples are given. The graphical technique is a simple informal way to select a statistical model and estimate its parameters. When a statistical distribution is found to fit the data well, the parameters can be estimated by analytical methods. Chapter 7 also introduces graphical methods, probability plotting, hazard plotting, and the Cox–Snell residual method for survival distribution fitting. Chapter 8 discusses several tests of goodness-of-fit and distribution selection. Chapter 9 describes several parametric methods for comparing survival distributions.
An important topic that has received much attention is the identification of prognostic factors related to survival time. For example, who is likely to survive longest after mastectomy and what are the most important factors that influence that survival? Another subject important to biomedical researchers and epidemiologists alike is the identification of the risk factors related to the development of a given disease or the response to a given treatment. What are the factors most closely related to the development of a given disease? Who is more likely to develop lung cancer, diabetes, or coronary disease? In many diseases, such as cancer, patients who respond to treatment have a better prognosis than patients who do not. The question, then, relates to which factors would influence response significantly. Who is more likely to respond to treatment and thus perhaps survive longer?
Chapters 10–13 deal with prognostic/risk factors and survival times. Chapters 10 and 11 introduce, respectively, a parametric model called the accelerated failure time model and the Cox proportional hazards model for identifying important prognostic factors. Chapter 12 discusses several nonproportional hazards models and a model to handle related survival times, namely, the frailty model. The last chapter, Chapter 13 introduces the linear logistic, conditional logistic and other regression models for the identification of risk factors that are related to dichotomous, polychotomous, or related outcomes.
The appendix gives several statistical tables for convenience.
Most nonparametric techniques discussed here are easy to understand and simple to apply. Parametric methods require an understanding of the survival distributions. Unfortunately, most of the survival distributions are not simple. Readers without calculus may find it difficult to apply them on their own. However, if the main purpose is not model fitting, most parametric techniques can be substituted for by their nonparametric competitors. In fact, a large percentage of the survival studies in clinical or epidemiological journals are analyzed...