Technical analysts build trading strategies based on trends and patterns in the markets' movements. Their task requires mastery of the world's markets and an understanding of the latest techniques.
Breakthroughs in Technical Analysis reveals the new trading methods used by the world's top technicians. Building on the success of New Thinking in Technical Analysis (Bloomberg Press, 2000), this book, edited by Bloomberg L.P.'s own expert on technical analysis, David Keller, brings together market masters from the around the world.
Some of their techniques have never left their country's borders before and are not widely known or used in other parts of the world.
Showing what the best and the brightest are currently using to deliver extraordinary results, this book will be eagerly sought out by all market technicians.
- English
- ePUB (mobile friendly)
- Available on iOS & Android
eBook - ePub
About this book
Trusted by 375,005 students
Access to over 1.5 million titles for a fair monthly price.
Study more efficiently using our study tools.
Information
CHAPTER 1
Drummond Geometry: Picking Yearly Highs and Lows in Interbank Forex Trading
TED HEARNE
What if you could predict the yearly high and the yearly low in a major currency? If, at the start of the year, you could have a definite idea where the high will form in the Japanese yen or the Canadian dollar or the euro? Or if you knew where the market was headed many months ahead of time? Making an educated, accurate forecast of next year’s high and low in every currency is surely the dream of every trader—a fantasy of omniscience and unlimited power over the markets.
In trading, as in war or building suspension bridges or performing transplant surgery or creating a new auto design or any complex undertaking, success is a function of many different elements—a combination of having the proper tools, the necessary knowledge, and the appropriate personal characteristics. If you would like to be one of the few who make accurate, high-probability, long-term forecasts about market highs and lows, then read on, because there are some little-known tools and a coherent body of knowledge that can help you.
Drummond Geometry
The practice of technical analysis has a few commonly accepted assumptions. Drummond Geometry builds on these with its own unique point of view:
1. Charts have patterns that can be identified and will reoccur.
2. Similar chart patterns exist in different time frames.
3. Prices in a given time frame will center on a consensus value, and when price moves away from that consensus, it will tend to revert to a mean. But this mean itself will be moving and changing as the market unfolds.
4. Support and resistance are real phenomena, and can be measured, predicted, and projected.
5. Time frame charts are interrelated, move simultaneously, and can be visualized as existing within each other.
6. Historical price charts of freely traded financial markets are the visual representation of human crowd psychology in action.
7. Support and resistance in different time frames react to price in predictable ways. The shorter time frames will react first, and then progressively longer time frames kick in.
These statements are simple, but when logically applied to the broadest context, using a coherent set of analytic tools, the implications are staggering. The trading theories and methodology I discuss here are based on the writings of Charles Drummond, the legendary Canadian trader who is emerging as one of the major market theorists of the twentieth century. He is not only a major theorist but also a hugely successful private trader who has the personal track record to back up the theory.
Drummond’s substantial body of writings, privately published and distributed under nondisclosure agreements to his growing body of students, constitutes a major step forward in technical analysis. Many aspects of the work remain proprietary and not accessible in a public medium, but some of the main principles and underlying concepts, as well as their application to the long-term Forex markets, are free to be discussed in forums such as this chapter.
The methodology has come to be known as Drummond Geometry and consists of three main elements, or components:
• T he identification of resistance and support and their projection into the future
• A description of the market’s current state and its next anticipated state
• M ultiple time period analysis, coordinating the first two elements in two, three, four, or more time frames
In Drummond Geometry, these three elements are combined into a coherent whole with specific rules for entries and exits, a methodology for monitoring and evaluating market moves, and a way to project viable turning points and targets within each time frame.
Projecting Resistance and Support
The idea of resistance and support is a key concept of technical analysis. Resistance is when buying peters out and selling increases, stopping and reversing an upward move; support is the reverse, when selling abates and buying begins, forcing price upward. Conventional technical analysis looks backward at where resistance and support have been located in the past and suggests that the same levels will be used in the future.
FIGURE 1.1
The PLdot
Source: Ted Hearne Associates, Inc.
Drummond Geometry takes a different approach. Although it constructs these levels out of conventional tools such as moving averages and trend lines, it projects constantly evolving resistance and support areas into the future and watches how price reacts to these levels as the market moves forward.
The core building block of Drummond Geometry is a short-term moving average called “the PLdot” (see Figure 1.1). The PLdot was developed in response to the search for a tool that would distinguish between trend and congestion and run in a straight line sloped upward or downward in a trend but that would quickly and responsively indicate changes in market situation. The tool was empirically derived, and investigations resulted in the moving average known as the “Drummond Dot,” or the PLdot.
The PLdot (PL stands for point and line) is a short-term moving average based on three price bars of data, which captures the trend/nontrend activity of the time frame that is being charted. The PLdot from the last three bars is plotted as a dot, or line, on the space where the next bar will appear.
The PLdot has a simple formula: the average of the average of the high, low, and close of the last three bars.

The PLdot can be applied to any chart of any commodity, future, or stock. The first thing to note is that the dot is always there. It is a polestar in a constantly shifting universe, something that bears a constant relationship with the immediate past, capturing the recent energy of the hour, of the day, or of whatever period the trader is looking at.
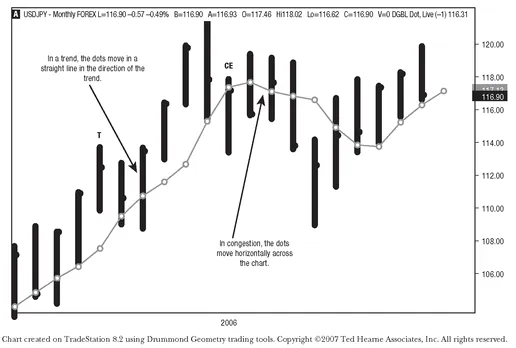
What is so special about this particular moving average, the PLdot, that sets it apart from other moving averages? The characteristics of the dot prove to be useful in analysis. It moves across the chart horizontally in congestion, and when a trend develops, it immediately changes into a straight line slanted in the direction of the trend with very little lag. It is extraordinarily sensitive to trending markets; very quick to register the change of a market out of congestion into trend and sensitive to a trend that is ending, as well.
The PLdot captures the heart of market activity on the last three bars. In Drummond Geometry, this point would be thought of as the center of energy and represents the consensus of the crowd. But additional tools are needed to gauge the strength of moves away from this consensus. For this, other moving averages are added. To give the methodology greater muscle, Drummond added a simple envelope system constructed of a constant mathematical relationship based on the components of the dot. The resulting structure is illustrated in Figure 1.2.
Unlike many envelope systems, the objective here is not to contain all price activity within the envelope but to offer a constant, or a matrix, against which market moves can be measured. This turns out to be of great value when trying to tailor trading techniques to different market conditions.
The envelope system is also useful as a constant against which to measure the strength of recent and current market energy. When the market is in congestion, price tends to oscillate from one side of the envelope to another; thus, the trader has a pretty good idea of where the buying and selling zones will be placed in the market. But when the market is in a strong trend, the envelope functions dif-ferently. The PLdot can be seen as “pushing” price in a trend, and the envelope top or bottom will be broken in the direction of the trend, with price bars often closing outside the envelope, and the envelope itself functioning as support or resistance. Price retracements in a trend will not move to the opposite side of the envelope but instead tend to stop at the level of the PLdot. In a strong trend, the bars will close outside of the envelope until the trend pauses or has finished, at which point they will move back inside the envelope.
FIGURE 1.2
The PLdot and Envelope in Trends and Congestion
Source: Ted Hearne Associates, Inc.

Both the PLdot and the envelope are useful elements in determining support and resistance levels, but by themselves they are not sufficient. To these elements, Drummond analysis adds a series of short-term, two-bar trend lines that flag areas where price is likely to terminate. In the full methodology, there are a significant number of these lines; here just a few are shown.
In Figure 1.3, we can see how these short-term trend lines contribute to the definition of nearby support and resistance areas (shown by a gray box) and the further out support and resistance areas (shown by a black-outlined box). Note also that these lines, along with the PLdot and the envelope, are projected into the near-term future, so that the trader always knows where the support and resistance areas are that the market is moving into. The trader does not focus on areas that existed in the past but is always oriented toward the developing future.
FIGURE 1.3
Short-Term Trend Lines
Source: Ted Hearne Associates, Inc.

If we apply these elements to a chart, we see the full envelope system together with the support and resistance zones established by the envelope, the dot, and the short-term trend lines, with these tools all projected into the future, onto the bar that has not yet formed. This setup constitutes the basic chart framework for any single time frame in Drummond Geometry. In Figure 1.4, we can see this full set of tools applied to a chart. Note the resistance and support areas plotted on top of each bar, along with the envelope and the PLdot. The price bars are plotted using a heavyweight “fat” bar so that the resistance and support tools can be plotted on top of them without obliterating the price bars themselves. The critical point is that these elements are projected forward into the future so that the trader always sees them coming up at him, on the right-hand side of the chart as time ticks forward and market activity unfolds.
FIGURE 1.4
Computer-Generated “Nearby Support” and Resistance Areas
Source: Ted Hearne Associates, Inc.

Now let’s stop and consider these few components of the first major section of Drummond Geometry. We have the definition of support and resistance; we have a means of monitoring market energy (placement and movement within and outside of the envelope system), a means of determining current market direction and future shifts in that direction (dot direction and slope), and a means of determining where price energy will terminate (where price is likely to stop for a given bar). All of these elements are extremely valuable to the trader. But as helpful as these tools are, by themselves ...
Table of contents
- Praise
- Also available from BLOOMBERG PRESS
- Title Page
- Copyright Page
- About the Contributors
- Acknowledgements
- Introduction
- CHAPTER 1 - Drummond Geometry: Picking Yearly Highs and Lows in Interbank Forex Trading
- CHAPTER 2 - Trend Spotting With TD Combo
- CHAPTER 3 - Charting With Candles and Clouds
- CHAPTER 4 - Reading Candlestick Charts
- CHAPTER 5 - Price and Time
- CHAPTER 6 - Unlocking Gann
- CHAPTER 7 - Options-Based Technical Indicators for Stock Trading
- CHAPTER 8 - Point and Figure Analysis: Modern Developments in an Old Technique
- CHAPTER 9 - Deconstructing the Market: The Application of Market Profile to ...
- CHAPTER 10 - The Ten Commandments
- Index
- About Bloomberg
- About the Editor
Frequently asked questions
Yes, you can cancel anytime from the Subscription tab in your account settings on the Perlego website. Your subscription will stay active until the end of your current billing period. Learn how to cancel your subscription
No, books cannot be downloaded as external files, such as PDFs, for use outside of Perlego. However, you can download books within the Perlego app for offline reading on mobile or tablet. Learn how to download books offline
Perlego offers two plans: Essential and Complete
- Essential is ideal for learners and professionals who enjoy exploring a wide range of subjects. Access the Essential Library with 800,000+ trusted titles and best-sellers across business, personal growth, and the humanities. Includes unlimited reading time and Standard Read Aloud voice.
- Complete: Perfect for advanced learners and researchers needing full, unrestricted access. Unlock 1.5M+ books across hundreds of subjects, including academic and specialized titles. The Complete Plan also includes advanced features like Premium Read Aloud and Research Assistant.
We are an online textbook subscription service, where you can get access to an entire online library for less than the price of a single book per month. With over 1.5 million books across 990+ topics, we’ve got you covered! Learn about our mission
Look out for the read-aloud symbol on your next book to see if you can listen to it. The read-aloud tool reads text aloud for you, highlighting the text as it is being read. You can pause it, speed it up and slow it down. Learn more about Read Aloud
Yes! You can use the Perlego app on both iOS and Android devices to read anytime, anywhere — even offline. Perfect for commutes or when you’re on the go.
Please note we cannot support devices running on iOS 13 and Android 7 or earlier. Learn more about using the app
Please note we cannot support devices running on iOS 13 and Android 7 or earlier. Learn more about using the app
Yes, you can access Breakthroughs in Technical Analysis by David Keller in PDF and/or ePUB format, as well as other popular books in Business & Investments & Securities. We have over 1.5 million books available in our catalogue for you to explore.