- English
- ePUB (mobile friendly)
- Available on iOS & Android
eBook - ePub
About this book
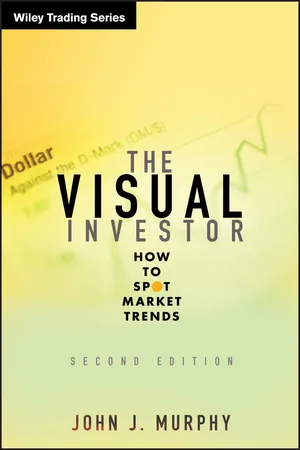
The Visual Investor, Second Edition breaks down technical analysis into terms that are accessible to even individual investors. Aimed at the typical investor--such as the average CNBC viewer--this book shows investors how to follow the ups and downs of stock prices by visually comparing the charts, without using formulas or having a necessarily advanced understanding of technical analysis math and jargon. Murphy covers all the fundamentals, from chart types and market indicators to sector analysis and global investing, providing examples and easy-to-read charts so that any reader can become a skilled visual investor.
SECTION ONE
Introduction
Traders and investors have been using a visual approach to investing for over a century. Up until the past decade, the use of visual analysis as a serious method of trading and investing was pretty much limited to professionals and full-time traders. Most successful traders would never think of making a trade without first consulting the pictures on their charts. Even the Federal Reserve Board now uses price charts.
WHAT HAS CHANGED?
For the average investor, however, the world of visual trading had been largely closed. The intimidating jargon and complicated formulas were beyond the reach and, indeed, the interest of the nonprofessional investor. A couple of important factors have changed that in the past decade. The most important is the availability of inexpensive computers and Internet charting services. The investing public now has an impressive array of technological and visual tools that weren’t available to the professional community 30 years ago.
The second development has been the dramatic expansion of the mutual fund industry to the point where more mutual funds exist than stocks now traded on the New York Stock Exchange. This phenomenal growth has produced both benefits and challenges for the average investor. The challenge lies in the fact that the job of choosing among mutual funds has been greatly complicated. In a very real sense, the mutual fund growth has made the task of the individual investor more difficult. The original purpose of mutual funds was to simplify investing. If someone didn’t have the time or expertise to pick stocks, that task could be turned over to a mutual fund manager. Besides professional management, instant diversification was provided. An investor could buy one fund and be in the market. Now, however, mutual funds are so segmented that the investor has a bewildering set of choices to make. In the past decade, the arrival of exchange-traded funds (ETFs) has replaced many mutual fund choices.
FUND CATEGORIES
Domestic stock funds are categorized by goal and style—aggressive growth, growth, growth and income, and equity income. Funds are also divided by the size or capitalization of the stocks included in their portfolios. Large-cap stock funds limit their portfolios to those stocks included in the Standard & Poor’s 500 stock index. Midsize funds focus on stocks included in the S&P 400 Mid-Cap Index or the Wilshire Mid-Cap 750. Small-cap funds choose their portfolios from the Russell 2000 or the S&P 600 Small-Cap Index. Stock funds can be further identified by their specialization in various stock market sectors, such as Technology, Basic Industry, Health Care, Financial Services, Energy, Precious Metals, and Utilities. Stock sectors can be further subdivided into industries with even more specified funds. The Technology sector, for example, would include funds that emphasize computers, defense and aerospace, communications, electronics, software, semiconductors, and telecommunications. Fidelity Investments offers as many as 40 sector funds for the individual to choose from.
GLOBAL FUNDS
Another dimension has been the growing popularity of global investing. Investors can now trade in individual foreign countries or geographic regions by selecting the appropriate stock fund. As a result, investors are forced to keep abreast of market developments not just in the United States, but all over the world. While overseas investing carries more risk than domestic funds, the rewards are well worth it. From 2003 through the end of 2007, foreign stocks rose more than twice as much as U.S. stocks.
During these same four years, emerging markets gained four times as much as the U.S. market. Overseas investing provides diversification from the U.S. market, which is why financial advisors recommend leaving as much as a third of one’s portfolio abroad to improve returns and lessen risk.
INVESTORS NEED TO BE BETTER INFORMED
For many investors, fund investing has replaced individual stock selection. However, with the degree of segmentation that has taken place in the stock fund industry, investors have little choice but to become better informed and more actively involved in the fund selection process. Investors must be aware of what different sectors of the American market are doing as well as how global markets are faring. The number of choices available to the investor is a mixed blessing.
So, too, are the technological advances of the past decade. The problem is knowing how to select and use the resources available. The technology has outpaced the public’s ability to use the new data in the most efficient way. Which brings us to the purpose of this book—to help the average investor quickly acclimate to visual trading; and then show how these relatively simple principles can be applied to the problem of sector investing primarily through exchange-traded funds.
BENEFITS OF VISUAL INVESTING
The bright side of the increased specialization among funds is that the investor has never before been provided with so many vehicles to choose from. Individuals who favor a certain market sector or industry, but don’t want to choose which stocks to buy, can now buy the whole group. Sector funds also provide additional ways to diversify one’s core stock holdings and to pursue more aggressive growth opportunities with a portion of one’s assets. That’s where visual analysis comes in.
The tools explained in this text can be applied to any market or fund anywhere in the world. With the aid of a computer and easy access to price data, the task of monitoring and analyzing funds has been made immeasurably easier. The power of the PC can also be harnessed for such things as monitoring portfolios, back-testing rules for buying and selling decisions, scanning charts for attractive opportunities, and ranking funds by relative performance. While the challenges of learning how to apply new technology to fund and sector investing are there, so are the rewards. If you’re in the market, you’ve already accepted the challenge. This book will show you how to reap the rewards.
STRUCTURE OF THE BOOK
The book is divided into four sections. Section One explains what visual analysis is and how it can be blended with more traditional forms of investment analysis. The critically important subject of market trend is explained, along with some visual tools to help identify the trend. You may be surprised to discover how much value lies in some of the simplest tools that are covered in the first section. Throughout the book, a special emphasis is placed on ETFs. Exchange-traded funds have greatly simplified the asset allocation and sector rotation process.
Section Two covers some of the more popular market indicators in use today. We stress the concepts behind the various indicators and how they are interpreted. We limit our coverage to only the most useful tools. For those wishing to explore the world of indicators more fully, reference sources are given at the end of the book.
Section Three introduces the idea of market linkages. This is especially important in order to appreciate why stock market investors should also monitor movements in commodity prices, bond prices, and the dollar. Intermarket analysis is also helpful in understanding asset allocation and the process of sector rotation within the stock market. Along the way, you’ll gain some insight into policy-making decisions of the Federal Reserve. You’ll be able to watch many of the same things the Fed watches.
Section Four focuses on sector analysis. Relative strength analysis is shown to play an important role in the selection process. We also show you how to analyze the global markets.
I’ll pull things together in the Conclusion with the admonition to keep things simple, along with some final thoughts. The Appendices will offer advice on getting started and where to find valuable resources to help you do so. The Appendices will also introduce some increasingly popular charting styles you might want to incorporate into your visual analysis.
CHAPTER 1
What Is Visual Investing?
They say a picture is worth a thousand words. Maybe they should have said a thousand dollars. After all, we’re talking here about using pictures to make money. And that’s really what this book is about. It’s that simple. A stock either goes up or down. If it goes up, and you own it, that’s good. If it goes down, and you own it, that’s bad. You can talk all you want about what a stock should be doing or why it isn’t doing what it should be doing. You can talk about inflation, interest rates, earnings, and investor expectations. Ultimately, however, it comes down to the picture. Is the stock going up or down? Knowing the reasons behind a stock’s movement is interesting, but not critical. If your stock goes up on a given day, they won’t take the money away from you if you don’t know why it went up. And if you can explain why it went down, they won’t give you back your lost money. All that really matters is a picture, a simple line on a chart. The trick to visual investing is learning to tell the difference between what is going up and what is going down. The goal of this book is to help you tell th...
Table of contents
- Title Page
- Copyright Page
- Dedication
- Preface
- Acknowledgements
- SECTION ONE - Introduction
- SECTION TWO - Indicators
- SECTION THREE - Linkage
- SECTION FOUR - Mutual Funds and Exchange-Traded Funds
- Conclusion
- APPENDIX A - Getting Started
- APPENDIX B - Japanese Candlesticks
- APPENDIX C - Point-and-Figure Charting
- Index
Trusted by 375,005 students
Access to over 1.5 million titles for a fair monthly price.
Study more efficiently using our study tools.
Frequently asked questions
Yes, you can cancel anytime from the Subscription tab in your account settings on the Perlego website. Your subscription will stay active until the end of your current billing period. Learn how to cancel your subscription
No, books cannot be downloaded as external files, such as PDFs, for use outside of Perlego. However, you can download books within the Perlego app for offline reading on mobile or tablet. Learn how to download books offline
Perlego offers two plans: Essential and Complete
- Essential is ideal for learners and professionals who enjoy exploring a wide range of subjects. Access the Essential Library with 800,000+ trusted titles and best-sellers across business, personal growth, and the humanities. Includes unlimited reading time and Standard Read Aloud voice.
- Complete: Perfect for advanced learners and researchers needing full, unrestricted access. Unlock 1.5M+ books across hundreds of subjects, including academic and specialized titles. The Complete Plan also includes advanced features like Premium Read Aloud and Research Assistant.
We are an online textbook subscription service, where you can get access to an entire online library for less than the price of a single book per month. With over 1.5 million books across 990+ topics, we’ve got you covered! Learn about our mission
Look out for the read-aloud symbol on your next book to see if you can listen to it. The read-aloud tool reads text aloud for you, highlighting the text as it is being read. You can pause it, speed it up and slow it down. Learn more about Read Aloud
Yes! You can use the Perlego app on both iOS and Android devices to read anytime, anywhere — even offline. Perfect for commutes or when you’re on the go.
Please note we cannot support devices running on iOS 13 and Android 7 or earlier. Learn more about using the app
Please note we cannot support devices running on iOS 13 and Android 7 or earlier. Learn more about using the app
Yes, you can access The Visual Investor by John J. Murphy in PDF and/or ePUB format, as well as other popular books in Business & Finance. We have over 1.5 million books available in our catalogue for you to explore.