A smart trader needs to know what other traders are thinking and doing. Professional traders and investors use a wide range of indicators—some well-known, some not so well-known—to gauge the state of the market.
Market Indicators introduces the many key indicators used by professional traders and investors every day. Having stood the test of time, these indicators will alert the trader to market situations that offer the best chance to trade profitably.
Richard Sipley is a portfolio manager for Boston Private Bank and Trust Company, responsible for trading millions of dollars of assets. Sipley uses these indicators every day in his trading and investing, and he draws on that experience to explain what they are, how they work, and how to use them.
eBook - ePub
Market Indicators
The Best-Kept Secret to More Effective Trading and Investing
- English
- ePUB (mobile friendly)
- Available on iOS & Android
eBook - ePub
About this book
Trusted by 375,005 students
Access to over 1.5 million titles for a fair monthly price.
Study more efficiently using our study tools.
Information
Part I
Measuring Investor Actions
As a general rule, the most successful man in life is the man who has the best information.
—BENJAMIN DISRAELI
MONEY DOESN’T FLOW—it sloshes. Like water in an overfull bathtub money moves in waves, as investors process information and balance the competing desires to grow wealth and protect capital. Traders use connections and quick thinking to react to new information, deciding how it may (or may not) affect capital returns. Thoughtful investors try to proactively position portfolios, rather than reacting impulsively to each new data point and market development.
As it sloshes, money creates a variety of measurable results, which signal how investors currently view risk and where they are placing bets. This first section reviews a variety of real-time indicators that point to capital allocation and reveal traders’ general levels of risk tolerance. Our first stop: the options market.
Chapter 1
Clues from the Options Market
Successful investing is anticipating the anticipations of others.
—JOHN MAYNARD KEYNES
IT CAN BE TOUGH ENOUGH to do well in the stock market. The options market, with its additional layers of complexity, might appear to be an even more challenging place to gain an advantage. Some of the smartest, quickest pros operate in the options market where, like traditional chess grand masters, they are slowly being outsmarted by computer algorithms. But there’s no need to battle the options pros or the computers to glean useful information from the options market.
The Basics
At its most basic, an option is simple. It’s the right to buy (call) or sell (put) a stock at a stated price (strike) until a certain point in time (expiration date). It’s not hard to understand, but it is hard to correctly value.
Though the mathematical specifics are beyond the scope of this book, traders use a few pieces of information to calculate an option’s price. These include the risk-free cost of money (due to the underlying loan that’s typically present), the stock price, the option’s strike price, and the amount of time left on the option. These are all known numbers. An unknown variable, called implied volatility, ties these known numbers together.
An option’s implied volatility measures how much the market thinks a stock’s value will change—in either direction—in the future. A boring company often has an established business base that probably won’t change much. An electric utility, for instance, has locked-in customers who provide a stable demand for product, although a state agency usually limits what the utility can charge. Relatively speaking, a utility’s future cash stream is predictable and will probably create a steady price for that utility’s stock, and therefore a relatively low implied volatility. Traders will not pay a high price for the right to buy the stock at a much higher level—a right known as a call—because traders think the stock has only a small chance of achieving that higher level.
On the other hand, a technology stock such as Google has a much higher implied volatility. After all, the stock’s value has changed significantly in the past, and Google’s future business and cash flow is more unpredictable than that of a utility. A call option—a bet that the stock will go up—on Google, therefore, is more expensive than a call option on Consolidated Edison.
For ease of use across option durations, sources state implied volatility in annualized terms. Note that implied volatility does not imply direction; it merely indicates the perceived magnitude of future price changes, both up and down.
What is the Volatility Index?
There is no need to independently calculate implied volatility. The Chicago Board Options Exchange (CBOE) introduced the Volatility Index (VIX) in 1993, and it became a popular media topic—albeit, one commentators often discuss oversimplistically. The VIX considers stocks traded on the S&P 500 Index and continuously calculates their implied volatility on a constant, forward-looking 30-day basis. In less technical language, the VIX measures the market’s price movement expectations over the next thirty days on the S&P 500. See more detail on the history of the VIX and its underlying calculations, as well as the current VIX and associated values, at the CBOE Web site (www.cboe.com).
WHY INVESTORS AND TRADERS LOOK AT THE VIX
The market essentially serves as a discounting mechanism for investors’ collective best guess of what the future holds. When investors disagree more than usual over the path of things to come, prices often bounce around as the market seeks equilibrium. At these moments, the VIX runs at relatively higher levels.
The VIX is also known as the investor fear index, because upward spikes are associated with bouts of market turmoil and uncertainty. Market participants are generally reluctant to put hard-earned cash to work in the market when the future seems murky and unsettled. Other investors may see reluctance as an overreaction to current news events and, therefore, as a buying opportunity.
At relatively low levels, the VIX suggests less disagreement over general stock prices. At these times, the VIX could be called the complacency index. Sustained low VIX levels resemble a quiet and placid lake, smooth as glass. Just a pebble can cause a disturbance. And so it is with the market. If investors expect a quiet market, any news event might cause a stir. Some investors therefore see low VIX levels as an opportunity to sell some stock and reduce market exposure.
STUDYING THE VIX
The VIX is based on data and has been around for many years, so it lends itself to academic study. Many academics are fascinated with the VIX, because it seems to dispel the notion of market efficiency.
In their December 2006 paper “Implied Volatility and Future Portfolio Returns,” Prithviraj Banerjee, James S. Doran, and David R. Peterson came to the following conclusions:
• They confirmed that the VIX had a statistically valid track record of forecasting stock market returns over one- and two-month time periods.
• This predictive ability was stronger for highly volatile stocks than for less volatile stocks. The forecasting effect was similar across stock type (growth and value) and company size (large and small).
• The authors were careful to conclude that the VIX was predictive, but did not state that VIX-based trading or investing would lead to market-beating returns.
Another study looked at using the VIX to beat the market. In their November 2007 paper “Can the VIX Signal Market’s Direction? An Asymmetric Dynamic Strategy,” Alessandro Cipollini and Antonio Manzini looked for a VIX strategy that beat a buy-and-hold approach. They stayed long to the market only when the VIX was at a relative high, and kept their account in cash at other times. They derived relative VIX levels by 1) finding high and low VIX values for a rolling twenty-four-month period, 2) dividing that range into twenty-two equal-value “buckets,” and 3) finding the forward three-month market returns for each day, and examining which bucket the VIX was in for each. They found that
• The VIX signals market direction, but is much more useful at high relative levels. Spikes are an especially reliable signal of market direction.
• Low VIX levels have much less predictive ability.
• The VIX had significant skews at its tails. The VIX spent only 0.82 percent of the study period (January 2, 1992 to December 31, 2004) in the highest VIX bucket, and 12.4 percent in the lowest, consistent with the argument that the VIX is better at finding market bottoms than market tops.
• Their constructed model beat a standard buy-and-hold model. The authors felt results would have been even better if the model had allowed more aggressive trading at the highest VIX readings.
A note from market research firm Bespoke Investment Group confirmed the finding that the VIX is more predictive at its highest values than at its lowest. The note discussed insights gathered from a study of more than thirty short-term VIX declines of more than 25 percent between January 1990 and April 2008. The authors concluded that “while sharp increases in the index have historically been a positive for the short-term performance of the market, sharp declines in the index do not necessarily have the opposite effect of negative short-term returns.”
USING THE VIX
These and other studies demonstrate that, as a predictor, the VIX is most accurate when it spikes from a relatively high level. This phenomenon can be used to time the market to some degree, particularly in short-term trading strategies, as the VIX considers only the next thirty days. Traders and portfolio managers use the VIX in different ways, with varying levels of conviction, as they seek out approaches that fit their needs and time frames.
We will focus on using VIX spikes to find periods of market dislocation. There are many possible approaches to consider.
MOVING AVERAGES
It can be dangerous to consider any indicator in absolute terms. Many investors tend to find an indicator level that has seemingly worked well in the past, and arbitrarily use that level as a future trigger point. But times and conditions change. It’s better to use the VIX by considering it in relation to the trends and trend deviations in its recent past.
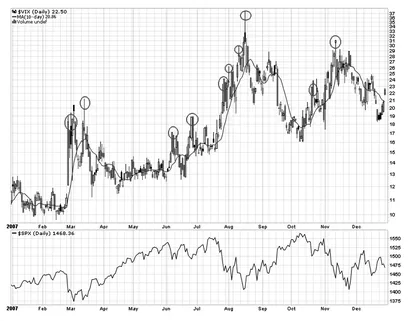
One way to look at relative trends and trend deviations is to use moving averages. A 10-day moving average for the VIX is very common, though this can be shortened or lengthened as desired. FIGURE 1.1 shows a 10-day VIX moving average (solid black line) for 2007, and the circled points at which the VIX spikes by at least 20 percent above those values. Such a relatively large deviation from a given moving average can signify short-term fear.
Figure 1.1 VIX 20 percent spikes away from 10-day moving average during 2007
Source: Chart courtesy of StockCharts.com (http://stockcharts.com)
BOLLINGER BANDS
Bollinger Bands, created by John Bollinger, is a charting tool that expands on moving averages and adds a trading range that’s based on a security’s historical volatility. This charting technique normally uses a 20-day moving average and adds bands representing two ...
Table of contents
- Title Page
- Copyright Page
- Acknowledgements
- Introduction
- Part I - Measuring Investor Actions
- Part II - Considering the Human Element
- Part III - Following the Smart Money
- Conclusion
- Notes
- Index
- About the Author
- About Bloomberg
Frequently asked questions
Yes, you can cancel anytime from the Subscription tab in your account settings on the Perlego website. Your subscription will stay active until the end of your current billing period. Learn how to cancel your subscription
No, books cannot be downloaded as external files, such as PDFs, for use outside of Perlego. However, you can download books within the Perlego app for offline reading on mobile or tablet. Learn how to download books offline
Perlego offers two plans: Essential and Complete
- Essential is ideal for learners and professionals who enjoy exploring a wide range of subjects. Access the Essential Library with 800,000+ trusted titles and best-sellers across business, personal growth, and the humanities. Includes unlimited reading time and Standard Read Aloud voice.
- Complete: Perfect for advanced learners and researchers needing full, unrestricted access. Unlock 1.5M+ books across hundreds of subjects, including academic and specialized titles. The Complete Plan also includes advanced features like Premium Read Aloud and Research Assistant.
We are an online textbook subscription service, where you can get access to an entire online library for less than the price of a single book per month. With over 1.5 million books across 990+ topics, we’ve got you covered! Learn about our mission
Look out for the read-aloud symbol on your next book to see if you can listen to it. The read-aloud tool reads text aloud for you, highlighting the text as it is being read. You can pause it, speed it up and slow it down. Learn more about Read Aloud
Yes! You can use the Perlego app on both iOS and Android devices to read anytime, anywhere — even offline. Perfect for commutes or when you’re on the go.
Please note we cannot support devices running on iOS 13 and Android 7 or earlier. Learn more about using the app
Please note we cannot support devices running on iOS 13 and Android 7 or earlier. Learn more about using the app
Yes, you can access Market Indicators by Richard Sipley in PDF and/or ePUB format, as well as other popular books in Business & Investments & Securities. We have over 1.5 million books available in our catalogue for you to explore.