The first part of this book is devoted to methods seeking relevant dimensions of data. The variables thus obtained provide a synthetic description which often results in a graphical representation of the data. After a general presentation of the discriminating analysis, the second part is devoted to clustering methods which constitute another method, often complementary to the methods described in the first part, to synthesize and to analyze the data. The book concludes by examining the links existing between data mining and data analysis.
Trusted by 375,005 students
Access to over 1.5 million titles for a fair monthly price.
Principal Component Analysis: Application to Statistical Process Control1
1.1. Introduction
Principal component analysis (PCA) is an exploratory statistical method for graphical description of the information present in large datasets. In most applications, PCA consists of studying p variables measured on n individuals. When n and p are large, the aim is to synthesize the huge quantity of information into an easy and understandable form.
Unidimensional or bidimensional studies can be performed on variables using graphical tools (histograms, box plots) or numerical summaries (mean, variance, correlation). However, these simple preliminary studies in a multidimensional context are insufficient since they do not take into account the eventual relationships between variables, which is often the most important point.
Principal component analysis is often considered as the basic method of factor analysis, which aims to find linear combinations of the p variables called components used to visualize the observations in a simple way. Because it transforms a large number of correlated variables into a few uncorrelated principal components, PCA is a dimension reduction method. However, PCA can also be used as a multivariate outlier detection method, especially by studying the last principal components. This property is useful in multidimensional quality control.
1.2. Data table and related subspaces
1.2.1.Data and their characteristics
Data are generally represented in a rectangular table with n rows for the individuals and p columns corresponding to the variables. Choosing individuals and variables to analyze is a crucial phase which has an important influence on PCA results. This choice has to take into account the aim of the study; in particular, the variables have to describe the phenomenon being analyzed.
Usually PCA deals with numerical variables. However, ordinal variables such as ranks can also be processed by PCA. Later in this chapter, we present the concept of supplementary variables which afterwards integrates nominal variables.
1.2.1.1. Data table
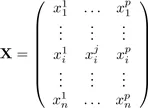
Let X be the (n,p)matrix of observations:
where
is the value of individual i for variable j (denoted xj ) which is identified with a vector of n components (
, . . . ,
)′. In a similar way, an individual i is identified to a vector xi of p components with xi = (
, . . . ,
)′.
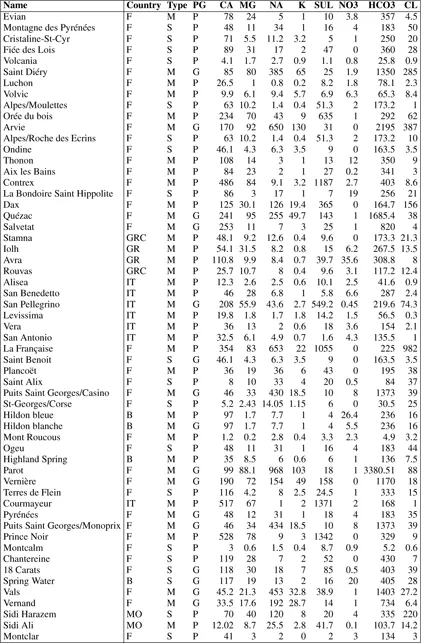
Table 1.1 is an example of such a data matrix. Computations have been carried out using SPAD 5 software, version 5 1, kindly provided by J.-P. Gauchi.
The data file contains 57 brands of mineral water described by 11 variables defined in Table 1.2. The data come from the bottle labels. Numerical variables are homogenous; they are all active variables (see section 1.4.3). A variable of a different kind such as price would be considered as a supplementary variable. On the other hand, qualitative variables such as country, type and whether still or sparkling (PG) are necessarily supplementary variables.
Table 1.1.Data table
1.2.1.2. Summaries
1.2.1.2.1. Centroid
Let
be the vector of arithmetic means of each of the p variables, defining the centroid:
Table 1.2.Variable description
Name
Complete water name as labeled on the bottle
Country
Identified by the official car registration letters; sometimes it is necessary to add a letter, for example Crete: GRC (Greece Crete)
Type
M for mineral water, S for spring water
PG
P for still water, G for sparkling water
CA
Calcium ions (mg/litre)
MG
Magnesium ions (mg/litre)
NA
Sodium ions (mg/litre)
K
Potassium ions (mg/litre)
SUL
Sulfate ions (mg/litre)
NO3
Nitrate ions (mg/litre)
HCO3
Carbonate ions (mg/litre)
CL
Chloride ions (mg/litre)
where
.
If the data are collected following a random sampling, the n individuals all have the same importance in the computations of the sample characteristics. The same weight pi = 1/n is therefore allocated to each observation.
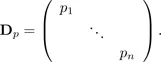
However, it can be useful for some applications to use weight pi varying from one individual to another as grouped data or a reweighted sample. These weights, which are positive numbers summing to 1, can be viewed as frequencies and are stored in a diagonal matrix of size n:
We then have the matrix expression
= X′Dp1n where 1n represents the vector of
n with all its components equal to 1. The centered data matrix associated with X is then Y with
and Y = X − 1n
′ = (In − 1n1n′ Dp)X, where In is the unity matrix of dimension n.
1.2.1.2.2. Covariance matrix and correlation matrix
Let
and
, the variance of variab...
Table of contents
Cover
Title Page
Copyright
Preface
Chapter 1: Principal Component Analysis: Application to Statistical Process Control
Chapter 2: Correspondence Analysis: Extensions and Applications to the Statistical Analysis of Sensory Data
Chapter 3: Exploratory Projection Pursuit
Chapter 4: The Analysis of Proximity Data
Chapter 5: Statistical Modeling of Functional Data
Chapter 6: Discriminant Analysis
Chapter 7: Cluster Analysis
Chapter 8: Clustering and the Mixture Model
Chapter 9: Spatial Data Clustering
List of Authors
Index
Frequently asked questions
Yes, you can cancel anytime from the Subscription tab in your account settings on the Perlego website. Your subscription will stay active until the end of your current billing period. Learn how to cancel your subscription
No, books cannot be downloaded as external files, such as PDFs, for use outside of Perlego. However, you can download books within the Perlego app for offline reading on mobile or tablet. Learn how to download books offline
Perlego offers two plans: Essential and Complete
Essential is ideal for learners and professionals who enjoy exploring a wide range of subjects. Access the Essential Library with 800,000+ trusted titles and best-sellers across business, personal growth, and the humanities. Includes unlimited reading time and Standard Read Aloud voice.
Complete: Perfect for advanced learners and researchers needing full, unrestricted access. Unlock 1.5M+ books across hundreds of subjects, including academic and specialized titles. The Complete Plan also includes advanced features like Premium Read Aloud and Research Assistant.
Both plans are available with monthly, semester, or annual billing cycles.
We are an online textbook subscription service, where you can get access to an entire online library for less than the price of a single book per month. With over 1.5 million books across 990+ topics, we’ve got you covered! Learn about our mission
Look out for the read-aloud symbol on your next book to see if you can listen to it. The read-aloud tool reads text aloud for you, highlighting the text as it is being read. You can pause it, speed it up and slow it down. Learn more about Read Aloud
Yes! You can use the Perlego app on both iOS and Android devices to read anytime, anywhere — even offline. Perfect for commutes or when you’re on the go. Please note we cannot support devices running on iOS 13 and Android 7 or earlier. Learn more about using the app
Yes, you can access Data Analysis by Gérard Govaert in PDF and/or ePUB format, as well as other popular books in Mathematics & Probability & Statistics. We have over 1.5 million books available in our catalogue for you to explore.