"This is a very timely book. With the recapitalization and reform of China's banking sector now well under way, the banks are on the brink of a new era of growth and expansion. This work is the definitive reference on the banking sector in China, and is an essential tool for anyone seeking to understand the dynamics of financial intermediation on the Mainland. It sets out the facts, free of the judgment calls that so often cloud the true picture of the health of China's banking system."
--Dr. David K.P. Li, Chairman and Chief Executive, The Bank of East Asia, Limited
"As China continues its impressive pace of economic growth, the rest of the world is constantly reassessing the opportunities and challenges it presents. This book is the first official report on the status of China's financial services industry and financial markets. For the first time, the international community gets access to the same information that the Chinese government uses in making key policies. Such unique insights make this book an essential read for business leaders, investors, policy makers, scholars, and anyone who is interested in understanding China's profound impact on businesses and consumers globally."
--Maurice R. Greenberg, Chairman & CEO, C.V. Starr & Co.
"This is the first book that introduces all aspects of the Chinese banking and financial markets to international audiences. From its developmental history to its contemporary challenges, China's banking and finance markets are presented, explored and analyzed with great detail and in great depth. Both the richness of the data and the scholarly strength of the methodology are a milestone. China's increasing participation in global financial markets makes this book a must read for all financial professionals worldwide."
--Lefei Liu, Chief Investment Officer, ChinaLife Insurance
eBook - ePub
China's Banking and Financial Markets
The Internal Research Report of the Chinese Government
- English
- ePUB (mobile friendly)
- Available on iOS & Android
eBook - ePub
China's Banking and Financial Markets
The Internal Research Report of the Chinese Government
Part I
Macro-economy and Policies
1
The Macroeconomic Situation
Economic growth
Since the initiation of its policy of reform and opening up in late 1978, China’s economy has maintained a comparatively rapid growth rate. However, constrained by the statistical methods used in China, our GDP, as formerly calculated, has been underestimated. In 2004, an economic census was, for the first time, conducted throughout the country. The results revealed a total GDP of around 16,000 billion yuan, at 2004 prices, which was 2,300 billion yuan more than the figure previously calculated. Subsequently, China’s total GDP was revised upward by 16.8%.
Using the trend-deviation method, the National Bureau of Statistics of China (NBSC) revised the historical data by estimating the corrected value of that data in accordance with the proportionality coefficient obtained by assessing, from 1993 to 2003, the proportion of the trend value of the original historical value and the substantial value. The GDP growth rate was thus revised and China’s average economic growth rate from 1978 to 2004 was calculated at 9.6%, up 0.2% on the figure previously calculated. The economic growth rates for half of those years exceeded 10%. Overall, with the gradual development of the Chinese market economic system, China has entered into a period of steady and rapid economic growth, during which the economic growth fluctuation rate is gradually diminishing, thus fundamentally changing the tremendous periodic fluctuations under the planned economic system.
In spite of the impact of unfavorable factors, such as sky-high petroleum and oil prices and concerns over the bird flu epidemic, the Chinese economy in 2005 still maintained strong growth momentum, with the annual GDP growing to 18,232.1 billion yuan. China’s total GDP in 2005 was equivalent to US$2,225.7 billion, calculated in accordance with the annual midpoint exchange rate, with the GDP per capital reaching US$1,700. Thus its total GDP surpassed that of France, making it the fifth-largest economy in the world.
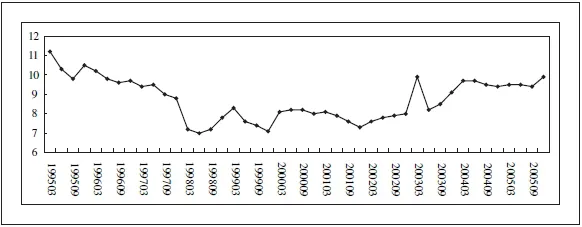
In 2005, China’s economic growth rate registered 9.9%, slightly lower than the 10.1% of the previous year, yet well above the 8% goal set by the government at the beginning of the year and also far more than that generally anticipated by the market and all relevant agencies. With market mechanisms playing a stronger role in resource allocation, the everincreasing development of macroeconomic controls by which the government can control the economy and the progressive development of the market economy, and the continuous deepening of the reform of the financial system, China’s economy is expected to maintain its sound momentum of development for the foreseeable future.
As indicated in the results of the economic census, with the significant year-on-year increase in total GDP and the escalation of the economic growth rate, we should note some data reflecting important proportional relations of the national economy and its internal variations. The percentage adjustments of the historical GDP, as obtained in the economic census, among primary, secondary and tertiary industries have been highly skewed. In the additional 2,300 billion yuan of total GDP, the added value of tertiary industry (service industry) grew by 2,130 billion yuan, accounting for a remarkable (but predictable) 93%. As a proportion of the total GDP, tertiary industry increased from 31.9% to 40.7%.
In 2005, the economic aggregate maintained a fairly rapid growth and, at the same time, the economic growth structure continued to improve. Although the high-energy-consumption manufacturing industry (secondary industry) is still the engine propelling China’s economic growth, and the contribution of primary industry to economic growth continued to drop, tertiary industry achieved strong momentum. In that year, the added value of primary industry reached 2,271.8 billion yuan, with a growth rate of 5.2%; that of the manufacturing industry totaled 8,620.8 billion yuan, a growth rate of 11.4%; and the added value of tertiary industry amounted to 7,339.5 billion yuan, a growth rate of 9.6%.
Figure 1-1: China’s economic growth since 1995 (Unit: %)
Source: National Bureau of Statistics of China
Investment and savings
China’s economic growth has been propelled, primarily and constantly, by the strong investment demand (capital formation). Since the advent of China’s policy of reform and opening to the outside world, its investment rate has been unsteady but generally high, rising during the early stages of this process, when the investment rate was 38%. In 2004, its investment rate moved up to the high level of 44%. Accordingly, China’s final consumption rate declined continuously, to the point where in 2005 it had dropped to 56% (see Figure 1-2).
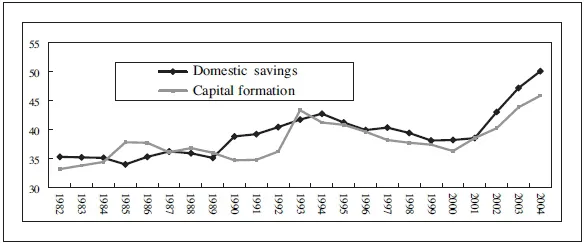
However, though China’s high investment rate is, more often than not, a concern, its savings rate showed the same growing trend. With the exception of 1993, since 1990 the savings rate has always been higher than the investment rate (see Figure 1-3). Based on this one aspect of economic operation, since the 1990s there appears to have been one noticeable inflation period in China (from 1993 to 1995). However, in most years the rate of price increases was kept under reasonably steady control, and from 1998 to 2001 (during the “Asian Financial Crisis”) there was even a historically rare period of deflation.
In view of the lag in microeconomic data, Chinese scholars generally use the change in the fixed-asset investment growth rate as the basis of their analysis, but this kind of analysis excludes the impact of inventory investment. Although the Chinese government enacted stringent tightening through macro-control measures — including in 2004 tightening monetary policies and imposing stricter credit policy, and in 2005 introducing various tax, banking and land-supply controls in a bid to curb the bubbling phenomenon of the realestate market — fixed-asset investments maintained a faster growth trend in 2005. The same year’s fixed-asset investment for society as a whole reached 8,860.4 billion yuan, a 25.7% increase over the previous year, with the growth rate dropping only 0.9 percentage points. Urban fixed-asset investments reached 7,096 billion yuan, up 27.2%; rural asset investments increased by 18.0%. The comparatively steady state of the investment growth rate serves to virtually guarantee the higher economic growth rate. However, urban fixedasset investments saw a gradual escalating trend. From January to February 2005, the nationwide urban fixed-asset investment growth rate was 24.5%, reaching 28.8% in June. These figures show that investment demand remained vigorous despite the government’s tightening measures.
Figure 1-2: China’s capital formation and final consumption rate through 2004 (Unit: %)
Source: 2005 China Statistical Yearbook
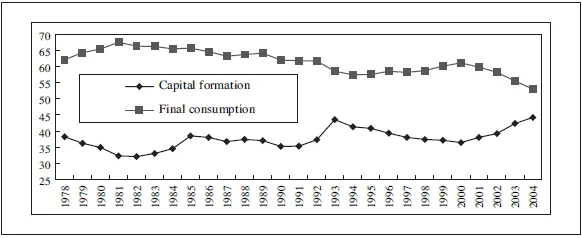
Figure 1-3: Domestic savings and capital formation rate (Unit: %)
Source: IMF
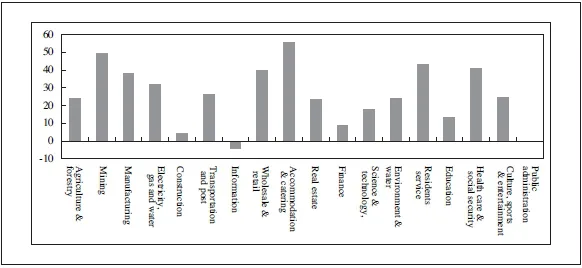
However, the structure of fixed-asset investments is still unbalanced. By the end of 2005 there were marked differences in the fixed-asset investment growth rates for all industries, mainly resulting from changes in the corresponding price levels in all industries. Prices in the mineral and mining industry, for example, increased considerably, attracting enterprises to increase their investment in the mining industry on a large scale. In 2005 the fixed investment growth rates in the mining and manufacturing industries rose by 49.5% and 38% respectively. The investment growth rate of the wholesaling and retailing industry, and the accommodation and catering industry, rose by 39.9% and 55.7% respectively. These figures illustrate that, despite the lower final consumption rate, the growth of real consumption demand of Chinese citizens was comparatively high.
It is worth noting that the investment growth rate of the real-estate industry, which drew the attention of the general public, was only 23.6%, some 4 percentage points lower than the growth in total fixed-asset investments. The fixed-asset investments in education, science and technology, water conservancy and the environment, and in the banking industry, for example, were far lower than the overall fixed-asset investment growth rate. In particular, the investment growth ratio of the information industry was negative for all months, while that for education accounted for no more than 50% of the total investment growth rate. From an industry-structure viewpoint, China’s current investment is still concentrated in the larger energy-consuming industries, which underlines the marked shortage of growth in the so-called intensive economy and in investments in efficient productivity driven by technological progress.
Figure 1-4: Growth rate of fixed asset investment of all trades in 2005 (Unit: %)
Source: National Bureau of Statistics of China
Looked at on a regional basis, fixed-asset investment was still concentrated in eastern regions where, in 2005, the fixed-asset investment growth rate reached 26.1%, mainly in Shanghai, Jiangsu, Zhejiang, Shandong and Guangdong. While the eastern regions’ proportion of the nationwide fixed-asset investment dropped slightly, from 55.2% in 2004 to 54.4%, it still remained high. Fixed-asset investment growth in the central regions — Hunan, Hubei, Henan, Jilin, Anhui, Shanxi, Jiangxi and Helongjiang — reached 34%, accounting for 22.2% of nationwide fixed-asset investments. This represented a 1 percentage point increase over the previous year. In the western regions the growth rate was 29.9%, which represented a slight decrease (from 21.5% to 21.3%) in its claim on the total nationwide fixed-asset investment in 2004.
As these regional figures indicate, despite the Chinese government’s attempts to redress the imbalances in regional economic development and the attendant economic and social problems arising from the development process through a succession of regional development strategies, the imbalances persist and will not be easily changed in the short term.
Prices
During the mid 1980s, the late 1980s and into the early 1990s, China experienced three noticeable periods of inflation, which were related to both reforms in its price system and the considerable increase in money supply. In the early 1990s, for instance, inflation was induced by removing controls on grain prices nationwide. During these periods of inflation, the investment growth rate was at the peak value of a periodic fluctuation. As a matter of fact, the large-scale gains associated with several spurts in the investment growth rate during these periods were largely accompanied by correspondingly high rates of inflation.
In 1994, China’s price index reached its peak following the reform and opening-up policies, subsequently falling little by little. From 1995, total domestic savings were larger than total domestic investments, which indicated a long-term trend, and thus the pattern of macroeconomic cooperation changed radically. And this change was reflected in the price level, such that in 1997 there was a fall in the price index and a low price growth rate was maintained for five consecutive years under the influence of the Southeast Asian financial crisis.
With the growth in income of both urban and rural residents, the deepening of housing-system reforms, the implementation of the accommodative monetary policy, and the adjustment of the asset structure of the commercial banks, after 2000 residents enjoyed greater economic mobility and, with the increased consumption, the commercial banks rapidly increased residential mortgage loans and loans for purchasing private motor vehicles. The demand for motor vehicles and houses was rising to unprecedented heights. As a consequence, from 2002, driven by the rebound of the investment growth rate, all kinds of price indices gradually rose and China was able, temporarily at least, to lift itself out of the deflationary period which had tormented the economy for so many years. In 2004 the consumer price index (CPI) rose by 3.9%. From 2004 to the spring of 2005, prices for some resource products, such as petroleum and mineral products, showed a marked increase, and there was a shortage of technical migrant workers in some regions,1 thus pushing up the wages for peasant workers. In addition the prices for water, electricity, liquefied gas and admission fees for tourism spots generally moved upwards, leading many people to predict that cost-push inflation would pose a great threat to China’s economy in 2005.
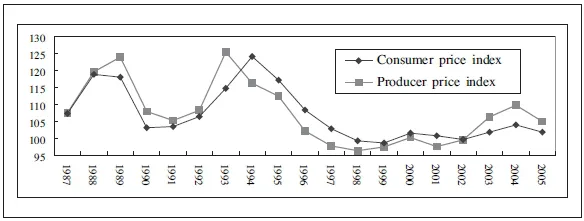
Nevertheless, the real price trend went against that which had been generally anticipated. Though investment, savings and economic growth rates all remained at a comparatively high level, there was no corresponding increase in prices. On the contrary, in fact; all kinds of price indices began to show a gradual and steady decline. In 2005, while the CPI climbed by 1.8%, the ex-factory price of manufactured goods rose by 4.9% and the purchasing price of raw materials, fuel and power increased by 8.3%, the annual purchasing price declined on a monthly basis, with the purchasing price of raw materials, fuel and power in December rising by only 5%. As the economy’s dependence on energy has been considerably reduced, the price hikes in energy and raw materials did not drive up the consumer price index. The overall falling trend for all kinds of price indices in 2005 illustrates that cost-push inflation did not materialize in China.
Figure 1-5: China’s price index (1987–2005)
Source: China Statistical Yearbook
The general price trend in 2005 was basically characterized by a fall followed by a rise. As Narrow Money (M1) continuously decreased, the CPI moved downwards from 3.9% in February 2005 to 0.9% in September, thus precipitating subsequent anxiety over potential deflation. After June, the M1 growth rate gradually flattened out and even showed signs of a slight upward movement. Conversely, the growth rate of Broad Money (M2) decreased drastically (on a monthly basis) and, affected by the change in the growth of the money supply, the CPI fell to its minimum point in September before gradually moving upwards to reach 1.6% in December (see Figure 1-6). All in all, the CPI in 2005 was lower than the one-year fixed-deposit rates and the so-called negative interest rate did not continue. As the price index falls, the pressure from price hikes diminishes, so China has not entered into the interest-raising period as experienced by the United States of America.2
The considerable monthly fall in the CPI in 2005 was caused by the slide of rice prices nationwide. As the weighting of food in CPI statistics reached 34%, so the price rise of 2.9% in foodstuffs drove the CPI up 1%. The upward trend in the CPI in 2004 was also fueled by rising grain prices, thus driving the current year’s grain price up 33%. The price of grain only rose by 1.4% for the whole of 2005, which was in sharp contrast to 2004 and led directly to the fall in the CPI. In 2005, with a deduction for the change in grain prices, the CPI registered 1.2%.
Compared with the considerable fluctuation in grain prices, other commodities which contribute to the CPI remained steady. On the whole, prices for durable consumer goods declined to some degree, but influenced by the upsurge in demand from urban consumers, the prices of residential products registered a slight increase.
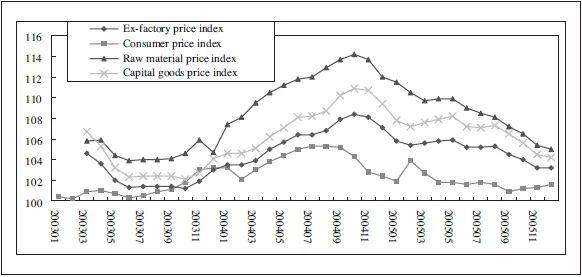
Figure 1-6: Changes in the price indices of all kinds in China
Source: National Bureau of Statistics of China
It is noteworthy that under the restrictive influence of price controls and the statistical methods employed, China’s current CPI cannot fully reflect the degree of inflation and the impact of price changes on domestic consumption. But with the progress of reforms to the pricing of resources, hidden inflation will be gradually released and the weights of all kinds of commodities that constitute the CPI package will change markedly. It is likely, therefore, that the statistical CPI will change in turn. However, the excessive supply of China’s final products as a whole will not be easily changed, thus reducing the motivation for a continuous rise in the CPI.
Though the overall trend of price indices of all kinds has remained consistent, the consumer price index remains at its lowest level and the purchasing price index of raw materials has reached its highest level to date. Furthermore, while the price index of capital goods was much lower than that of raw materials, it was higher than the ex-factory price of manufactured goods. With respect to the basic characteristics of price changes, the further upstream the products are, the higher the prices; the further downstream the products are, the lower the prices — a circumstance that is determined by the differences in the degree of market competition of all kinds of products and the r...
Table of contents
- Cover
- Contents
- Title page
- Copyright page
- Preface
- Acknowledgments
- Contributors
- Advisory Committee
- About the Editors
- About the Sponsor
- Part I: Macro-economy and Policies
- Part II: Financial Institutions
- Part III: Financial Markets
- Part IV: Balance of Payments and Exchange Rate
- Part V: Legal and Institutional Environment for Financial Development
- Index
Frequently asked questions
Yes, you can cancel anytime from the Subscription tab in your account settings on the Perlego website. Your subscription will stay active until the end of your current billing period. Learn how to cancel your subscription
No, books cannot be downloaded as external files, such as PDFs, for use outside of Perlego. However, you can download books within the Perlego app for offline reading on mobile or tablet. Learn how to download books offline
Perlego offers two plans: Essential and Complete
- Essential is ideal for learners and professionals who enjoy exploring a wide range of subjects. Access the Essential Library with 800,000+ trusted titles and best-sellers across business, personal growth, and the humanities. Includes unlimited reading time and Standard Read Aloud voice.
- Complete: Perfect for advanced learners and researchers needing full, unrestricted access. Unlock 1.5M+ books across hundreds of subjects, including academic and specialized titles. The Complete Plan also includes advanced features like Premium Read Aloud and Research Assistant.
We are an online textbook subscription service, where you can get access to an entire online library for less than the price of a single book per month. With over 1.5 million books across 990+ topics, we’ve got you covered! Learn about our mission
Look out for the read-aloud symbol on your next book to see if you can listen to it. The read-aloud tool reads text aloud for you, highlighting the text as it is being read. You can pause it, speed it up and slow it down. Learn more about Read Aloud
Yes! You can use the Perlego app on both iOS and Android devices to read anytime, anywhere — even offline. Perfect for commutes or when you’re on the go.
Please note we cannot support devices running on iOS 13 and Android 7 or earlier. Learn more about using the app
Please note we cannot support devices running on iOS 13 and Android 7 or earlier. Learn more about using the app
Yes, you can access China's Banking and Financial Markets by Robert Lawrence Kuhn,Li Yang in PDF and/or ePUB format, as well as other popular books in Business & Finance. We have over 1.5 million books available in our catalogue for you to explore.