
- English
- ePUB (mobile friendly)
- Available on iOS & Android
eBook - ePub
Practical Applications in Engineering
About this book
This series of five volumes proposes an integrated description of physical processes modeling used by scientific disciplines from meteorology to coastal morphodynamics. Volume 1 describes the physical processes and identifies the main measurement devices used to measure the main parameters that are indispensable to implement all these simulation tools. Volume 2 presents the different theories in an integrated approach: mathematical models as well as conceptual models, used by all disciplines to represent these processes. Volume 3 identifies the main numerical methods used in all these scientific fields to translate mathematical models into numerical tools. Volume 4 is composed of a series of case studies, dedicated to practical applications of these tools in engineering problems. To complete this presentation, volume 5 identifies and describes the modeling software in each discipline.
Trusted by 375,005 students
Access to over 1.5 million titles for a fair monthly price.
Study more efficiently using our study tools.
Information
Part1
Operational Hydrology
Chapter 1
Developing the Flood Alert Map 1
This document consists of experience feedback concerning the bad weather conditions of August 11 and 12, 2008, which led to the production of orange level maps and yellow level maps and which were the subject of category-orange weather alert maps and category-yellow flood alert maps. The document’s aim is to present a summary of the framework constituted by the various numerical tools used by forecasters from the SCHAPI-SPC network and to illustrate their usage in the form of a simple example.
1.1. Flood alert
The SCHAPI (French National Hydrometeorological and Flood Forecasting Center), along with the 22 local flood forecasting services, has published a flood alert map at least twice a day since December 2005. This map presents the hydrological risk across the 20,000 kilometers that make up the regulatory network monitored by the French government. In July 2007, Météo-France and the SCHAPI decided to produce a single “rain and flooding” pictogram, combining Météo-France’s “heavy precipitation” risk and the SCHAPI-SPC network’s “flood” risk. This required work to be carried out repeatedly by Météo-France weather forecasters and the SCHAPI-SPC network’s hydrologist forecasters.
A single portal offers access to both alert maps (http://www.meteofrance.com/vigilance/index.jsp).
Here we will describe the methods and tools made use of and employed to produce the flood alert map. We have taken as an example the relatively minor event of August 11-12, 2008, placing the emphasis more on the methodology used than on describing the event itself. The presentation is broken down into two stages, which illustrate the forecaster approach:
– the date is August 11: Météo-France forecasts heavy rain for the following day. Flood forecasters then estimate the risk for their watercourses over a timescale of 24 hours, and publish the flood alert map;
– the following day, August 12, we use on the field measurements to draw up an assessment of yesterday’s alert.
Let us recall to begin with that the alert consists of qualifying the risk for a period to come (in this instance, 24 hours), in order to enable civil security members and the general public to take the precautions needed in order to be sheltered from risk. On the technical level, risk anticipation is based on exploiting the weather predictions in an essentially qualitative manner. As soon as there is a rainfall, it is recorded by the ground network of rain gauges and radars which feed into the hydrological models, which in turn provide forecasts of flow rates in the watercourses. Flood forecasters make use of a variety of information sources in order to develop their alert map.
| Analysis of the hydrometeorological situation from the previous day to present day | Rainfall Soil condition Floods in progress | Storm drainage systems + rain rate (ANTILOPE) Soil moisture map (SIM). Hydrograph measured + hydrological forecasts |
| Weather forecasts from the present day to the following day Hydrological forecasts (several hours) | Forecast rain rate Forecast flow-rates | Results of meteorological models: ARPEGE, ALADIN, ECMWF Hydrological models (here: ALTHAIR) |
| Hydrometeorological risk estimation for the following day | Production of the flood alert map | Rain flow charts |
The event of August 11–12 brought about contributions from the Grand Delta and Rhône Amont Saône SPCs (flood forecasting services), along with the SCHAPI, for the alert maps issued on August 11 at 4 p.m. and August 12 at 10 a.m.
1.2. Developing flood alert maps for August 11–12, 2008
1.2.1. Analysis of the hydrometeorological situation
The meteorological situation on August 11–12, 2008 is characterized by a succession of several storm disturbances passing over France.
On August 11, 2008 the hydrological situation is calm, with the last significant floods on the regulatory network dating back over a month. Figure 1.1 shows that in the last 24 hours, no rain has dampened the soil on the Cévennes and Rhône basins.
Figure 1.1. ANTILOPE rain rate: accumulation of rainfall observed over the last 24 hours on August 11 at 12 p.m. UTC across the South of France
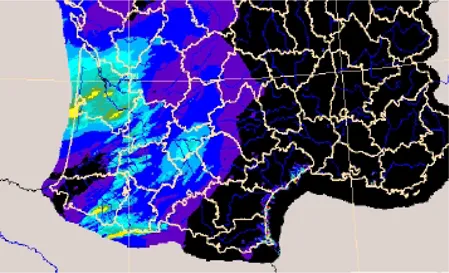
A first rain storm disturbance (named “T”) rapidly crosses France from the West to the East on the 11th, giving accumulations that remain low, less than 10 mm for the most part.
However, Météo-France forecasts the rapid arrival of a new disturbance (named “U”) from the West in the afternoon of the 11th, which is to cross France the following night, stopping at the Eastern end of the country on the 12th, and merging with the first disturbance.
Satellite and radar images available to forecasters (Figure 1.2) enable them to locate these different elements and monitor their development with respect to time.
Figure 1.2. Satellite (visible channel) and radar image on August 11, 2008 at 12 p.m. UTC. The majority of disturbance “U” is beyond the radar network’s range

1.2.2. Weather forecasts
Météo-France provides the SCHAPI-SPC network with several types of meteorological information:
(1) precipitation reports (PRs) indicating the accumulations forecast over a 24- hour period, issued by the interregional departments of Météo-France at a rate of two a day, or more if needed. The reports are issued on the scale of zones generally corresponding to river basins which are relatively large in size (Figure 1.3).
SCHAPI forecasters are sent other meteorological information, issued directly from the Météo-France numerical forecast models, ARPEGE and ALADIN (Figure 1.4);
(2) precipitation forecast maps over 24 hours by “Symposium” zone. These zones are smaller than the PR zones, but correspond to zones that are climatically homogeneous and not to hydrological basins (Figure 1.5);
(3) a “risk indicator-type” product is also available, using what is known as the analog method. This method researches past meteorological situations closest to the forecast situation, using them to determine the probability of the rainfall thresholds being exceeded on various stations located in the Cévennes and in the Alps.
Figure 1.3. Zones used for precipitation reports. The colors identify the areas covered by the different SPCs (for a color version of this figure see www.iste.co.uk/tanguy/EH4.zip)
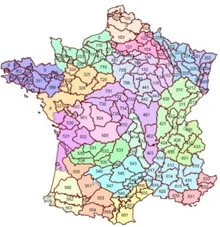
Figure 1.4. ARPEGE accumulation forecast from August 11, 08 to August 12, 08 at 12 p.m. UTC. The zones expected to be most affected are the Ardèche and the Gardons to the South and the Ain and the Doubs to the North
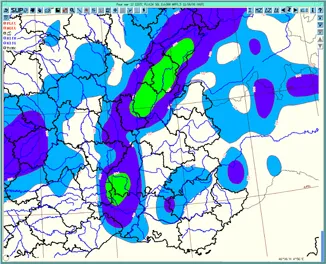
1.2.2.1. Results of the numerical models
As an example of the products available to the SCHAPI, presented below are four meteorological fields taken from the Météo-France ARPEGE forecast model, which were available on the morning of August 11 and valid for August 12 at 12 p.m. UTC.
Figure 1.5. Fields available to the SCHAPI on the SYNERGIE workstation (from top to bottom and left to right: geopotential, temperature and wind at 500 hPa - altitude 1.5 PVU, theta’w at 850 hPa, frontology – CAPE and wind at a distance of ten meters – rain accumulation over six hours) (for a color version of this figure see www.iste.co.uk/tanguy/EH4.zip)
The unprocessed forecasts presented above (Figure 1.5) have not been evaluated by Météo-France. Nevertheless, they offer flood forecasters an understanding of the overall meteorological situation, highlighting the flow type (top left-hand map); the activity, position and displacement velocity of the fronts (top right-hand map); the storm potential (bottom left); the rainfall forecast by the ARPEGE model over a given time period (here: six hours). These fields can be animated for forecast timescales covering 0 to 96 hours.
The “unprocessed” outputs of the numerical models available to the SCHAPI enable accumulations to be produced for periods of the user’s choice. Whilst these values ar...
Table of contents
- Cover
- Title Page
- Copyright
- Introduction
- PART 1. OPERATIONAL HYDROLOGY
- PART 2. FLUVIAL HYDRAULICS
- PART 3. HYDROGEOLOGY
- PART 4. GENERATION AND PROPAGATION OF FLOODS IN AN URBAN ENVIRONMENT
- PART 5. ESTUARY HYDRODYNAMICS
- PART 6. MARITIME HYDRAULICS
- PART 7. TRANSPORTATION OF DISSOLVED SUBSTANCES, POLLUTION
- PART 8. FLUVIAL AND MARITIME MORPHODYNAMICS
- List of Authors
- Index
- General Index of Authors
- Summary of the Other Volumes in the Series
Frequently asked questions
Yes, you can cancel anytime from the Subscription tab in your account settings on the Perlego website. Your subscription will stay active until the end of your current billing period. Learn how to cancel your subscription
No, books cannot be downloaded as external files, such as PDFs, for use outside of Perlego. However, you can download books within the Perlego app for offline reading on mobile or tablet. Learn how to download books offline
Perlego offers two plans: Essential and Complete
- Essential is ideal for learners and professionals who enjoy exploring a wide range of subjects. Access the Essential Library with 800,000+ trusted titles and best-sellers across business, personal growth, and the humanities. Includes unlimited reading time and Standard Read Aloud voice.
- Complete: Perfect for advanced learners and researchers needing full, unrestricted access. Unlock 1.5M+ books across hundreds of subjects, including academic and specialized titles. The Complete Plan also includes advanced features like Premium Read Aloud and Research Assistant.
We are an online textbook subscription service, where you can get access to an entire online library for less than the price of a single book per month. With over 1.5 million books across 990+ topics, we’ve got you covered! Learn about our mission
Look out for the read-aloud symbol on your next book to see if you can listen to it. The read-aloud tool reads text aloud for you, highlighting the text as it is being read. You can pause it, speed it up and slow it down. Learn more about Read Aloud
Yes! You can use the Perlego app on both iOS and Android devices to read anytime, anywhere — even offline. Perfect for commutes or when you’re on the go.
Please note we cannot support devices running on iOS 13 and Android 7 or earlier. Learn more about using the app
Please note we cannot support devices running on iOS 13 and Android 7 or earlier. Learn more about using the app
Yes, you can access Practical Applications in Engineering by Jean-Michel Tanguy in PDF and/or ePUB format, as well as other popular books in Physical Sciences & Hydrology. We have over 1.5 million books available in our catalogue for you to explore.