- English
- ePUB (mobile friendly)
- Available on iOS & Android
eBook - ePub
Essentials of WRAML2 and TOMAL-2 Assessment
About this book
Essentials of WRAML2 and TOMAL-2 Assessment introduces professionals to these two widely used memory measurement batteries, both of which measure memory and are used to supplement evaluations of ADHD and reading problems in youngsters, as well as a number of other disorders across the age span. Written by Wayne Adams and Cecil Reynolds, this essential reference provides administration guidelines, including procedural suggestions and solutions for common problems examiners may encounter; expert assessment of each test?s relative strengths and weaknesses; valuable advice on clinical applications; and illuminating case reports.
Trusted by 375,005 students
Access to over 1.5 million titles for a fair monthly price.
Study more efficiently using our study tools.
Information
Four
INTERPRETATION OF THE WRAML2
Before we begin a discussion surrounding interpretation of WRAML2 results, a quick, general overview of interpretation of test scores seems in order. The question often is, with all the scores available, how does the clinician choose the best score (s)?
LEVELS OF ANALYSIS
As with other tests of cognitive ability, the WRAML2 may be interpreted using different levels of analysis; commonly included are (a) the combined index level (i.e., the General Memory Index), (b) the separate index level (the Visual, Verbal, and Attention/Concentration Indexes; Working Memory and Recognition Memory Indexes might also be included), (c) individual subtest level (some combination of the six core and possibly additional optional subtests), and (d) some combination of the prior three levels.
Test interpretation based upon multiple test findings is always the preferred basis of interpretation because, generally, more items (i.e., more sampling) provide stronger psychometric properties for the resultant estimate(s). Consequently, using the General Memory Index (GMI) provides the strongest psychometric basis for formulating a WRAML2 interpretation since the GMI is made up of three index or six subtest scores, which themselves are each made up of numerous memory items. Using a combined score is always preferred unless the component scores contributing to that summary score are found to be highly variable—that is, disagree among themselves.
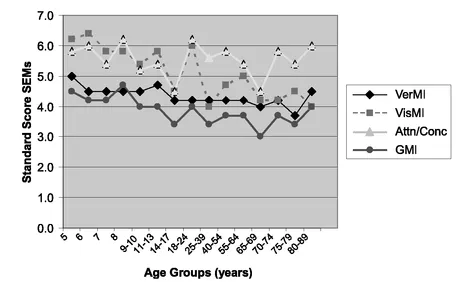
As usual, index variability is related to the standard error of measurement (SEM) between the index scores. Index SEMs for various age ranges are found in Table 7.10 of the WRAML2 Manual. The SEMs have been plotted in Figure 4.1 by age. As can be observed, the SEMs are somewhat different for each of the core indexes, with the Verbal Memory Index generally showing the least variability. Attention /Concentration shows the most, especially for adults. While there are some changes with age, those changes are relatively small other than for the Visual Memory Index, which shows the greatest variability for the youngest participants, but shows variability comparable to the Verbal Memory Index by young adulthood. As would be expected, the score with the greatest number of items, the composite score known as the General Memory Index, has less variability than any of its contributors.
Figure 4.1 Standard Errors of Measurement for Verbal, Visual, and Attention/Concentration Indexes, as well as the composite, General MemoryIndex
GMI Versus Index Level of Analysis
To justify performing interpretive analyses at the GMI level, there should be relative consistency or sameness between the index scores. Just what constitutes indexes that are consistent or different is somewhat arbitrary, but generally, once index scores differ by more than 2 SEMs from each other, the summary index score (GMI) should be avoided. Discrepancy data found in Table A.8 of the WRAML2 Manual are based on the SEM data and provide the test user with the now-familiar information for determining statistical significance at both the .15 and .05 levels for each of the age groupings. Prevalence rates for differences between indexes are found in Table A.9 of the WRAML2 Manual. As with IQ measures, determining meaningful discrepancies between indexes can be based on statistical and/or clinical (i.e., prevalence) differences.
For precision, one should use the tabled values. However, as indicated in Rapid Reference 4.1, a convenient rule of thumb is to start suspecting that statistical differences exist once index differences exceed 10 points.

Putting it into Practice
Interpreting Differences Rules of Thumb:
• Suspect Index differences are interpretable if > 10 standard score points
• Suspect Subtest differences are interpretable if > 3 scaled score points
(But use tabled values for actual decision making.)
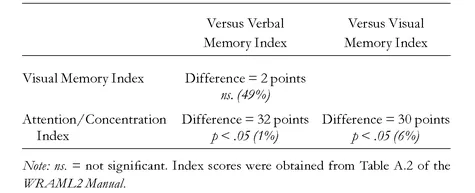
When a significant difference between core indexes is found, the composite score (i.e., the GMI) is likely a misleading summary statistic; and in such circumstances, the examiner should move to the next level of analysis, namely the core index level. Examples of this instance are provided in Tables 4.1 and 4.2. Using the WRAML2 Manual’s Table A.8, the mean difference between the Attention/Concentration Index score and the other two index scores (Verbal and Visual) exceeds the .05 critical difference value (12.1) for a client of this age. Table A.9 further indicates that differences of this magnitude rarely occur (compared to the standardization sample). Therefore, the GMI summary statistic is suspect. In this case, the GMI suggests the client’s general memory skills are within the low average range. As can been seen, none of the three index scores falls within the low average range; two index scares are solidly average and one is within an impaired range. Therefore, one can observe that if interpretation occurs at the GMI level of analysis, an erroneous generalization would be made, and one would miss a relative weakness (assuming this kind of weakness can be supported with additional test findings or history). When significant amounts of variability are noted among index scores, proceed to the next level of score analysis (i.e., move from GMI to individual core index scores) for interpretation. Some clinicians would argue that the GMI should not even be reported because of the risk of possible misinterpretation.
Table 4.1 A Misleading GMI for a 17-year-old Client Because of Significant Variability Among the Contributing Core Indexes
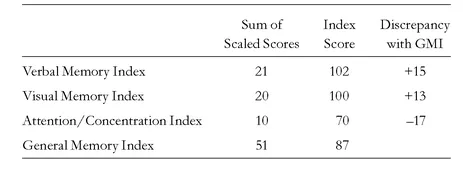
Table 4.2 Differences Between Index Scores, Associated Statistical Significance Levels, and Prevalence Rates (in parentheses) for Index Scores Found in Table 4.1
Using the WRAML2 Manual’s Table A.2, the mean differences between index scores exceed 2 SEMs, and therefore the GMI summary statistic is suspect. In this case, the summary statistic (i.e., the GMI) suggests the client’s general memory skills are within the low average range. Further, none of the three index scores falls within the low average range; two index scores are solidly average and one is within an impaired range.
To restate the principle, if the GMI is made up of index scores that are fairly close to each other, the GMI is the preferred statistic for reporting and interpretation. However, if there is significant variability between any of the three core indexes, then the GMI should probably be avoided as a summary statistic. Instead, the examiner should move to the next level of analysis, namely to the Verbal, Visual, and Attention/Concentration Index scores, despite their somewhat lower reliabilities.
Index Versus Subtest Level of Analysis
Similarly, each of the core or optional indexes should be used for interpretation, provided that the two subtests contributing to an index score are fairly similar. However, once again, if the subtests contributing to an index score differ significantly, then the index is probably a misleading summary statistic. Discrepancy analysis results are not tabled for the many core subtest differences across the various age groups. Standard error of measurements (SEMs) for core subtests are provided in Table 7.11 of the WRAML2 Manual. The SEMs differ by subtest and age group, but generally are slightly more than 1 scaled score point. Therefore, as a rule of thumb, if subtests contributing to an index differ by more than 3 scaled score points (>2 SEMs), the index score is probably not a representative summary statistic and the subtest scores would provide a better level of analysis. (Again, the actual tabled subtest SEMs should be used rather than this rule of thumb, for actual decision-making situations.) To the degree that the subtest scores contributing to an index differ more than 3 scaled score points, it is to that degree you should be cautious about using that index for interpretive purposes. Note that SEMs for optional and Delay Recall and Recognition subtests are found in Table 7.12 of the WRAML2 Manual. Working Memory SEMs and several other optional subtests’ SEMs are found in Table 7.13.

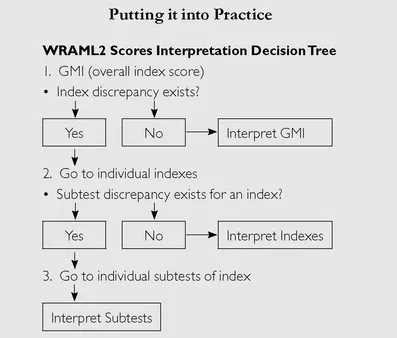
The best strategy for selecting the soundest score(s) for interpretation is to use the test score(s) consisting of the most items; however, as the contributing scores increasingly differ, their average (the summary score) will increasingly misrepresent the client’s ability. The remedy is to move down one interpretive level, although the cost is decreased reliability. This strategy can be seen using a decision tree format in Rapid Reference 4.2. With this guideline in mind, we will turn to the topic of test interpretation of the various WRAML2 scores generated.
INDEX SCORE INTERPRETATION
Following the guidelines discussed in the preceding sections of this chapter, using the GMI score makes sense when the three indexes are generally in agreement. Therefore, a low GMI (with similarly low Verbal, low Visual, and low Attention/Concentration Indexes) would suggest that a client has general impairment in laying down new memories, regardless of content or sensory modality. This overall difficulty with immediate memory (and long-term) processes would be expected for a client with a severe congenital condition, such as overall developmental delay, or could result from a major generalized acute insult such as a sustained anoxic episode associated with drowning.
In addition, with clinical referrals, it is relatively common to find differences between Visual, Verbal, and/or Attention/Concentration Indexes. When this occurs, the interpretive picture usually involves subdomains of differential weaknesses. Therefore, a low Verbal Memory Index (compared to Visual or Attention/Concentration) would usually be made up of low Story Memory and Verbal Learning subtest scores. In such cases, laying down new verbal memories, especially with linguistic content, is likely difficult for the client. Remembering conversations, lectures, or the content of phone messages will likely be noticeably impaired. Similarly, a low Visual Memory Index would predict difficulty remembering new visual information, such as that related in correctly retracing one’s route to a new office or classroom, or recalling a graph seen in the morning newspaper or in a textbook (as well as where on the page it was located). A low Attention/Concentration Index is usually associated with difficulty with rote learning tasks, possibly when proper sequence is important. Examples of such memory demands include correctly recording an advertised phone number just heard on a radio ad, remembering who sat where within the room when reflecting on a meeting that occured earlier in the day, or the correct spelling of an infrequently used phonetically irregular word.
The clinical meaning of differences between indexes needs to be qualified. A 20-point difference seems substantial, although whether it will be noticeable clinically will likely depend on what is the overall level of the client’s memory functioning. For example, a person who achieves a Verbal Memory Index of 140 with a Visual Memory Index of 120 has differential memory ability on the test, but he/she may go through life unaware of the relative weakness in Visual Memory because his/her weakness is at a level far above the majority of age mates. Plus, that client may well use compensatory memory abilities from the formidable verbal memory domain to assist when encountering relative weaknesses in the visual. Conversely, a client with Verbal and Visual Index scores of 75 and 55 may perceive a difference in remembering verbal versus visual information, but the disparity may not be noticed by instructors or employers because of the marked degree of weakness that characterizes both domains. Plus, the area of relative strength is not strong enough to compensate for another area of marked weakness. Generally, differences between index scores have noticeable and ecologically meaningful effects the greater the differences a...
Table of contents
- Title Page
- Copyright Page
- Dedication
- SERIES PREFACE
- One - FOUNDATIONS: MEMORY AND ITS MEASUREMENT
- Two - OVERVIEW OF THE WRAML2
- Three - ADMINISTRATION AND SCORING OF THE WRAML2
- Four - INTERPRETATION OF THE WRAML2
- Five - OVERVIEW OF THE TOMAL-2
- Six - ADMINISTRATION AND SCORING OF THE TOMAL-2
- Seven - INTERPRETATION OF THE TOMAL-2
- References
- Annotated Bibliography
- Index
- About the Authors
Frequently asked questions
Yes, you can cancel anytime from the Subscription tab in your account settings on the Perlego website. Your subscription will stay active until the end of your current billing period. Learn how to cancel your subscription
No, books cannot be downloaded as external files, such as PDFs, for use outside of Perlego. However, you can download books within the Perlego app for offline reading on mobile or tablet. Learn how to download books offline
Perlego offers two plans: Essential and Complete
- Essential is ideal for learners and professionals who enjoy exploring a wide range of subjects. Access the Essential Library with 800,000+ trusted titles and best-sellers across business, personal growth, and the humanities. Includes unlimited reading time and Standard Read Aloud voice.
- Complete: Perfect for advanced learners and researchers needing full, unrestricted access. Unlock 1.5M+ books across hundreds of subjects, including academic and specialized titles. The Complete Plan also includes advanced features like Premium Read Aloud and Research Assistant.
We are an online textbook subscription service, where you can get access to an entire online library for less than the price of a single book per month. With over 1.5 million books across 990+ topics, we’ve got you covered! Learn about our mission
Look out for the read-aloud symbol on your next book to see if you can listen to it. The read-aloud tool reads text aloud for you, highlighting the text as it is being read. You can pause it, speed it up and slow it down. Learn more about Read Aloud
Yes! You can use the Perlego app on both iOS and Android devices to read anytime, anywhere — even offline. Perfect for commutes or when you’re on the go.
Please note we cannot support devices running on iOS 13 and Android 7 or earlier. Learn more about using the app
Please note we cannot support devices running on iOS 13 and Android 7 or earlier. Learn more about using the app
Yes, you can access Essentials of WRAML2 and TOMAL-2 Assessment by Wayne Adams,Cecil R. Reynolds in PDF and/or ePUB format, as well as other popular books in Psychology & Research & Methodology in Psychology. We have over 1.5 million books available in our catalogue for you to explore.