![]()
PART I
Measuring Performance
Chapter 1—The Right Objective, Strategy, and Metric
Chapter 2—Expectations Count: The Evidence
This section sets the stage. Chapter 1 discusses the major flaws in traditional measures of performance and points out the salient fact that they are not correlated with the total return to shareholders (TRS) because they have no information about expected outcomes. Expectations-Based Management™ (EBM™) does have high correlation with TRS because it looks at performance relative to expectations. Chapter 2 provides irrefutable empirical evidence that EBM is highly correlated with market-adjusted total return to shareholders while other measures are not.
![]()
CHAPTER 1
The Right Objective, Strategy, and Metric
We are writing about one of the most important CEO top-of-mind issues—performance measurement. The way people behave in the workplace and the value that they create depends on it. The challenge is to align performance measurement and the resulting behavior with shareholder wealth creation. There are many gurus who claim to have found the secret link, but they all fail to account for the effect of changes in expectations. Consequently, none of their own measures of performance is highly correlated with the total return to shareholders (TRS). This book introduces, for the first time, an Expectations-Based Management (EBM) system, which measures performance in a way that is highly correlated with TRS.
But this book is not just for management, although they play a fundamental role in setting expectations. It is also written for investors who believe in using fundamental information to set their expectations of company performance, and analysts who forecast financial results and make investment recommendations. It is also, incidentally, for legislators who regulate the rules that determine the cost and flow of information that affect all securities prices.
To create a TRS higher than the normal return, a company has to exceed expectations. Why? Because expectations are already baked into its stock price. In October of 1998, Intel, a company that was regularly earning a return on invested capital 30 to 40 percent more than its cost of capital, announced that its earnings were up 19 percent over the year before. Immediately thereafter, its stock price fell six percent—because analysts had been expecting a 24 percent earnings increase. Intel’s price corrected downward because it failed to meet expectations. Expectations count!
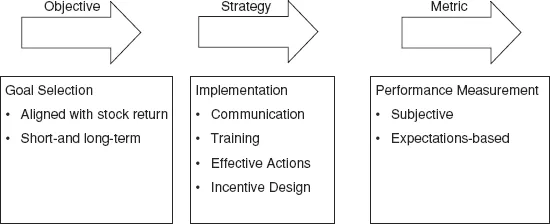
Any human endeavor involving teamwork requires three things: a common objective, a way of measuring progress toward that objective, and methods for achieving the desired performance. Figure 1.1 illustrates these three interrelated issues.
We often take them for granted. But if any of the three is wrong, the team is likely to fail. Even agreement about what the objective should be is sometimes hard to achieve—some would say impossible. This book is about management’s choice of an objective—maximization of owners’ wealth, the choice of a measure of performance that is aligned with it, and the management implementation method that best achieves the desired performance.
For the objective function, or goal, of a company we use the expression “owners’ wealth” as a synonym for TRS to call attention to the fact that this objective applies equally well to privately as to publicly owned firms. When a company has publicly traded stock, the objective by corporate charter is to maximize the total return to shareholders.
Sometimes a team chooses the wrong objective. For example, we knew of a college soccer team where the coach stressed defense, and rewarded the team because it led the league for having the lowest average number of goals scored against them. No one can deny that the goal of having a good defense is laudable. But what if we tell you that the team won only 2 of 14 games that season and finished dead last? It lost many games 1 to 0 or 2 to 1. Good defense is fine, but not as good as scoring more goals than your opponent before the last whistle sounds. The team was pulling together and working hard—achieving an “A” for effort—but it had the wrong objective.
Sometimes an organization has the right objective. However, mistakes about the appropriate measure of performance have resulted in classic failures—the stuff that Barbara Tuchman wrote about in The March of Folly. For example, she writes of Britain’s loss of America (1763–1765):
Britain’s goal was clear, yet her ministries repeatedly took measures that injured the relationship, and in the end she made rebels where there had been none. Tuchman goes on to analyze the folly: “...while the colonies were considered of vital importance to the prosperity and world status of Britain, very little thought or attention was paid to them.”2 This myopic behavior was caused by failure to give proper weight to the value (in investment terms, the net present value) of the colonies to England. Instead, Britain placed greater weight on immediate concerns, such as raising taxes to provide reimbursement for the standing army in the Americas to defend against Native Americans and resurgence of the French. This short-term behavior caused England to lose sight of the larger goal of keeping the Americas. As we shall see, the analogy extends to companies and their managements—namely, the misapplication of myopic performance measures, such as maximizing short-term earnings at the expense of long-term earnings growth.
If the team’s objective is appropriate, and if it chooses measures of performance that are appropriately aligned with the objective, there is still the problem of implementation. This third part of the management system is at the grass roots of everyday management and is discussed later in the book as training, identification of value drivers, and incentive design.
This book is about a management system that we call Expectations-Based Management. It accepts the maximization of owners’ wealth as the objective of companies, shows that performance measurement must be based on changes in expectations in order to link the performance measurement to the stated objective, and then discusses implementation. All three parts of an EBM system should work together to achieve the best possible performance toward achievement of the goal.
Why Is Performance Measurement Top-of-Mind?
The team that has the right goal and the right resources usually wins—regardless of the competitive activity. In the United States at the beginning of the third millennium, one can confidently argue that the economic, legal, and socially desirable objective of corporations is to maximize owners’ wealth. Yet this tautology is discussed endlessly, because management does not have direct control over a firm’s stock price. Rather, management influences the share price by achieving and communicating past, present, and future performance. The trick is to find a strong link between the measure of performance and actually winning in the stock market, thereby creating wealth. It may surprise you to learn that Economic Value Added (EVA®) (also called economic profit) and commonly used performance measures, such as earnings per share and the growth in earnings per share, are definitely not related to the total return to shareholders. (See Chapter 2, which reviews the preponderance of empirical evidence that confirms this fact.)
Like a team of horses, a high-performance management team has to pull together to win in competition, but it also must steer in the right direction. That is why performance measurement is always a top-of-mind topic for CEOs. This book not only suggests a common-sense performance measure; it also provides concrete evidence (taken from real market data) that this measure is closely linked to your firm’s stock price.
Commonly Used Performance Measures and Their Shortcomings
Every top manager becomes a believer in a causal linkage between the company’s performance objectives and its stock price. The only problem is that there are a lot of choices. A partial (but not exhaustive) list, based on our experience, is broken down here. Every performance measure has its problems.
Top-Line Growth
Top-line growth is simply the growth in sales revenues (or sales turnover). Its link to shareholder returns is weak at best, for several reasons. First, sales growth is a double-edged sword when it comes to value creation. It increases value when sales are profitable, but destroys value when each unit sold is unprofitable. Table 1.1 shows what we mean. On one axis is the five-year average sales growth rate for companies, broken down into five categories ranging from very high sales growth rates (greater than 12 percent per year) to very low or negative growth rates. Along the other axis is the spread between the company’s return on invested capital and its cost of capital (a decent measure of economic profitability). Within each of the 30 cells is the ratio of the market price per share divided by the book value per share—its market-to-book ratio. Higher market-to-book ratios are representative of strong economic growth. The table clearly indicates that revenue growth is related to higher stock prices only...