After studying statistics and mathematics at the University of Munich and obtaining his doctoral degree from the University of Dortmund, Andreas Ziegler received the Johann-Peter-Süssmilch-Medal of the German Association for Medical Informatics, Biometry and Epidemiology for his post-doctoral work on "Model Free Linkage Analysis of Quantitative Traits" in 1999. In 2004, he was one of the recipients of the Fritz-Linder-Forum-Award from the German Association for Surgery.
Trusted by 375,005 students
Access to over 1.5 million titles for a fair monthly price.
Working on genetic epidemiological questions, we have to deal with a variety of information. On the one hand, as in other epidemiological approaches, we use clinical and environmental information. For instance, we might be interested in the relationship between fairer or darker skin, the extent of sun exposure, and the development of malignant melanoma. On the other hand, our specialty is to incorporate genetic information. We might therefore want to look at whether these relationships are mediated by genetic factors. The result might suggest that because of their genetic background, some people are more susceptible to melanoma even though they have darker skin. But what exactly is this genetic background? The aim of this chapter is to familiarize ourselves with this kind of genetic data.
Specifically, we first need to understand what the biological substance of the genetic information is, where it is located in the human body, what it means, and how it is translated for further use. These questions will be answered in Section 1.1. What distinguishes genetic information from other information is that parts of it are transmitted from generation to generation. Understanding the biological mechanisms that underlie this concept forms the basis for later test statistics, and this will be the focus of Section 1.2. Finally, to be useful for statistical purposes, genetic information has to be subject to variation. Hence, the last section of this chapter is devoted to the questions of how individuals differ with regard to their genetic information, how variations can occur, how they can be detected, and how likely the detection is.
This chapter will not give a comprehensive overview on human molecular genetics. Instead, we will focus on issues that are important to understand the statistical methods introduced later. For more in-depth descriptions, the reader is referred to standard textbooks on this topic (e.g., Refs. [254, 636]). Readers who are already familiar with molecular genetics could certainly skip this chapter, especially those who feel comfortable with the problems at the end of this chapter.
1.1 WHAT IS THE NATURE OF GENETIC INFORMATION?
1.1.1 Where is the genetic information located?
Every human cell except the red blood cells has a nucleus that carries an individual’s genetic information in chromosomes. At the same time, chromosomes are found almost exclusively in the nucleus of the cell. Hence, almost every cell of the body carries the information that is required for the entire organism. The chromosomes are composed of deoxyribonucleic acid (DNA) and proteins.The DNA is the carrier of the genetic information, whereas the protein components provide different functions.
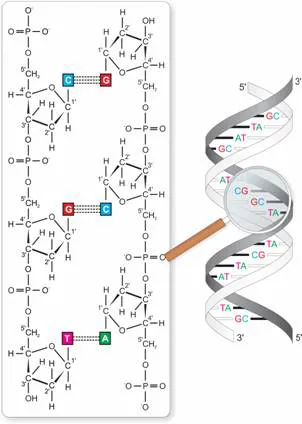
The DNA is a large molecule consisting of two strands. Each strand has a linear backbone of alternating sugar (deoxyribose) and phosphate residues. To facilitate the description of the structure, the five carbon atoms of the deoxyribose are consecutively numbered from 1′ to 5′ (see Figure 1.1, left-hand side). Covalently attached to the backbone is a sequence of bases. Here, four bases are found, with adenine (A) and guanine (G) being purines, and cytosine (C) and thymine (T) being pyrimidines. The structural unit of one sugar with an attached base is called a nucleoside, and one nucleoside with a phosphate group tied to the carbon atom 5′ or 3′ makes one nucleotide. In addition to this structure of a single strand, the two strands of the DNA molecule are connected by a hydrogen bond between two opposing bases of the two strands. Specifically, thymine always bonds with adenine via two hydrogen bonds, and cytosine with guanine via three hydrogen bonds. The resulting DNA resembles a ladder whose sides are connected by the bases. However, because of the chemical nature of its components, the ladder does not go straight up but is slightly twisted, which is why it has been described as a double helix (Figure 1.1, right-hand side).
Fig. 1.1 Schematic structure of the DNA. The left-hand side shows the sugar phosphate backbone of the DNA with attached carbon atoms and bases. Two backbones are connected via the bases with two or three hydrogen bonds. The right-hand side is zoomed out to depict that the two strands are slightly twisted, forming the double helix.
Any two DNA fragments differ only with respect to the order of their bases. Therefore, the genetic information we are looking for is coded exactly in the linear sequence of the bases of the DNA fragment. This linear sequence of the bases is called the primary structure of the DNA. Because the bonding of the bases between the two strands is specific, the two strands can be said to be complementary, meaning that the sequence of one strand can be exactly inferred from the other. As a consequence, if one wants to describe the sequence, it suffices to write the sequence of one strand. Here, it has become customary to write the sequence in the 5′ to 3′ direction. The basic length unit of the DNA is one nucleotide, or one basepair (bp), which refers to the two bases that connect the two strands. In total, the human DNA contains about 3.3 billion bp.
As a second carrier of genetic information in addition to the DNA in chromosomes, copies of parts of the DNA are found in smaller molecules called ribonucleic acid (RNA) in the nucleus and the surrounding plasma of the cell. The RNA is constructed in a way very similar to the DNA but shows four main differences. In addition to being much shorter, RNA consists of only a single strand instead of two. Also, this single strand is slightly different from a single DNA strand in that the sugar component is made up of ribose instead of deoxyribose. Finally, although the other bases are the same, uracil (U) is found instead of thymine.
The total set of genetic information is distributed in a series of 23 chromosomes. Of these, 22 are autosomes that are consecutively numbered from 1, the longest chromosome, to 21 and 22, the shortest chromosomes. Chromosomes 1 and 2 encompass more than 240 million bp, whereas chromosomes 21 and 22 have no more than 50 million bp. The remaining chromosome is one of the sex chromosomes X and Y, with lengths of about 152 million bp and 50 million bp, respectively. A cell containing a single set of chromosomes with all 22 autosomes and one of the two sex chromosomes is termed to be haploid. A regular human cell, however, is diploid, meaning that it contains a double set, with one coming from the father and the other coming from the mother. Hence, a regular cell has 2·22 = 44 autosomes and two sex chromosomes. Specifically, cells in a female contain two X chromosomes, whereas males carry one X chromosome and one Y chromosome in their cells. There are two regions on the X and Y chromosomes deserving special attention. They are the pseudoautosomal regions PAR1 and PAR2 which are homologous sequences of nucleotides on the X and Y chromosomes. The PARs behave like an autosome. Thus genes in this region are inherited in an autosomal rather than a strictly sex-linked fashion. PAR1 comprises 2.6 million bp of the short-arm tips of both X and Y chromosomes in humans. PAR2 is located at the tips of the long arms, spanning 320 kilo bp; the PARs are comprehensively reviewed in Ref. [437].
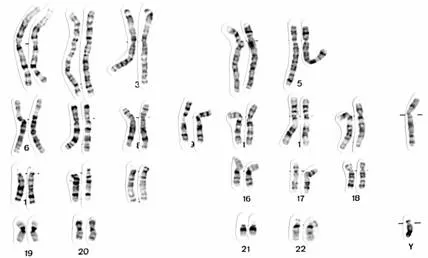
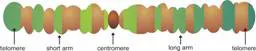
At a specific point in the division of a cell, the chromosomes can be made visible under the light microscope. When they are stained with certain dyes, they reveal a specific pattern of light and dark bands reflecting regional variations in the amounts of the bases. Differences with respect to length and the banding pattern allow the chromosomes to be easily distinguished from each other, as is visible in Figure 1.2. This figure shows an example of the karyotype of a healthy male, which is the constitution of the chromosomes of an individual according to standard classification systems. On a single chromosome, different structural elements are distinguished (see Figure 1.3). At the ends of the chromosome, the telomeres have special functions involved in the duplication of the chromosomal ends during cell division. A corresponding structure nearclose to the middle of the chromosome is the centromere. The short arm of the chromosome is usually termed p for petit (small) and the long arm, q for queue (tail). Accordingly, the telomeres are referred to as pter and qter, respectively.
Fig. 1.2 Karyogram of a healthy male. This figure was kindly provided by the Institut für Humangenetik, Universit¨atsklinikum Schleswig-Holstein, Campus Lübeck, Germany.
Fig. 1.3 Schematic structure of a chromosome with its characteristic elements.
1.1.2 What does the genetic information mean?
After explaining that the genetic information is stored in the linear sequence of the bases of DNA or RNA, we now need to read this information. For this, it is important to note that most functions in human organisms are carried out by proteins. Proteins consist of polypeptides, which are nothing but a linear sequence of repeating units that are called amino acids. In humans, 20 different amino acids occur. Hence, there needs to be a translation between the linear sequence of four different bases in the DNA or RNA into a linear sequence of 20 different amino acids for a protein.
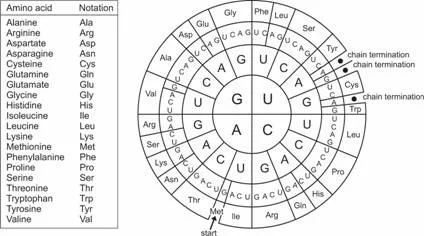
How does a base sequence translate into protein structure? It has been found that three bases, a triplet, code for one amino acid. Accordingly, the sequence of three bases is called a codon. Using such a three-letter code, it is possible to form 43 = 64 different codons from four possible bases. Because there are only 20 amino acids that need to be coded, the genetic code can be said to be degenerate, with the third position often being redundant. Depending on the starting point of reading, there are three possible variants to translate a given base sequence into an amino acid sequence. These variants are called reading frames. The beginning of the translation process from bases into amino acids is signaled by special functional start codons, mostly A(denine)-U(racil)-G(uanine). The opposite stop codons, for instance, U(racil)-A(denine)-G(uanine), will terminate the translation. It should be noted that in practice, the translation of bases into amino acids does not use DNA but RNA; the base uracil appears in the code that is displayed in Figure 1.4.
Fig. 1.4 Codon table to translate RNA into amino acid. The codon table is read from center to outside, so that, for example, the sequence A (center) U (middle) G (outside) codes for the amino acid Met (methionine) and at the same time serves as an initiation site for translation (see Section 1.1.3).
1.1.3 How is the genetic information translated?
As we have seen, genetic information is basically a construction plan for proteins. Hence, we now need to understand how, beginning with the DNA, proteins are actually synthesized. Because of the importance of this process, protein synthesis has been termed the central dogma of molecular biology. To anticipate the major pathway, this dogma has been expressed as:
DNA makes RNA, RNA makes proteins, proteins make us.
The overall process of protein synthesis can be partitioned into two steps. First, we have to remember that DNA is stationary and located in the nucleus of the cell. In contrast, protein synthesis takes place in the surrounding plasma of the cell. Therefore, the first step involves the transcription of DNA into messenger RNA (mRNA) that then carries the information from the nucleus into the plasma. More specifically, the DNA double helix is unwound and unzipped into single strands. Catalyzed by the RNA polymerase enzyme, the strand in the 5′ to 3′ direction is used as a template. Led by the polymerase that migrates from one nucleotide to the next, free RNA nucleotides anneal to the DNA and are tied together to a strand. After coming across a stop signal, the RNA strand uncouples from the DNA that is then again zipped together with its complementary strand. The resulting RNA subsequently leaves the nucleus of the cell. Because the RNA now has the same direction and base sequence as the strand of the DNA that was not used as a template, this non-template strand is called the sense strand. In contrast, the template DNA strand is termed the antisense strand.
After the transcription, the RNA molecule is further edited. Specifically, the socalled introns are cut out, whereas exons are spliced together. For a large number of segments, multiple alternative splicing variants exist. Finally, unique features are added to each end of the transcript to make a mature mRNA.
The transcription process is regulated by a number of factors. For example, several kinds of the enzyme RNA polymerase and associated protein transcription factors regulate the specificity and rate of transcription. Specific regions of the DNA called promoters that include binding sites for the RNA polymerases control the initiation of the transcription. In addition, transcription can also be regulated by variations in the DNA structure or by chemical changes in the bases. One such important chemical modification is methylation. The degree of methylation tends to be negatively correlated with the functional activity of DNA and plays an important role, for example, in genomic imprinting (see Section 2.3.3).
The second step of protein synthesis involves the translation of the genetic information that is now contained in the mRNA from genetic code into proteins. The process of translation takes place in the cell plasma at cell organelles called ribosomes. After the actual synthesis of amino acid sequences, the proteins are further modified. The advantages of this procedure are that only small segments of DNA are used at a time and that many transcriptions and translations can be rapidly made.
After describing the nature of our genetic information in some depth, we should briefly turn to the question of what a gene actually is...
Table of contents
Cover
title
Copyright
Dedication
Preface
Acknowledgments
1: Molecular Genetics
2: Formal Genetics
3: Genetic Markers
4: Data Quality
5: Genetic Map Distances
6: Familiality, Heritability, and Segregation Analysis
7: Model-Based Linkage Analysis
8: Model-Free Linkage Analysis for Dichotomous Traits
9: Model-Free Linkage Analysis for Quantitative Traits
10: Fundamental Concepts of Association Analyses
11: Association Analysis with Unrelated Individuals
12: Association Analysis in Families
13: Haplotypes in Association Analyses
14: Genome-wide Association Studies
Appendix Algorithms Used in Linkage Analyses
Solutions to Study Problems
References
Index
Frequently asked questions
Yes, you can cancel anytime from the Subscription tab in your account settings on the Perlego website. Your subscription will stay active until the end of your current billing period. Learn how to cancel your subscription
No, books cannot be downloaded as external files, such as PDFs, for use outside of Perlego. However, you can download books within the Perlego app for offline reading on mobile or tablet. Learn how to download books offline
Perlego offers two plans: Essential and Complete
Essential is ideal for learners and professionals who enjoy exploring a wide range of subjects. Access the Essential Library with 800,000+ trusted titles and best-sellers across business, personal growth, and the humanities. Includes unlimited reading time and Standard Read Aloud voice.
Complete: Perfect for advanced learners and researchers needing full, unrestricted access. Unlock 1.5M+ books across hundreds of subjects, including academic and specialized titles. The Complete Plan also includes advanced features like Premium Read Aloud and Research Assistant.
Both plans are available with monthly, semester, or annual billing cycles.
We are an online textbook subscription service, where you can get access to an entire online library for less than the price of a single book per month. With over 1.5 million books across 990+ topics, we’ve got you covered! Learn about our mission
Look out for the read-aloud symbol on your next book to see if you can listen to it. The read-aloud tool reads text aloud for you, highlighting the text as it is being read. You can pause it, speed it up and slow it down. Learn more about Read Aloud
Yes! You can use the Perlego app on both iOS and Android devices to read anytime, anywhere — even offline. Perfect for commutes or when you’re on the go. Please note we cannot support devices running on iOS 13 and Android 7 or earlier. Learn more about using the app
Yes, you can access A Statistical Approach to Genetic Epidemiology by Andreas Ziegler,Inke R. Kônig,Friedrich Pahlke,Inke R. König in PDF and/or ePUB format, as well as other popular books in Biological Sciences & Genetics & Genomics. We have over 1.5 million books available in our catalogue for you to explore.