![]()
Part 1
Productivity
What productivity do we get from our projects and the investment we make?
How can a business or CIO measure the functional yield of projects and the project portfolio?
What is the cost of failure?
What are the four actions we need to take to lift productivity and project success?
Is it good enough for the business when it “just survives” delivery of a project? No.
What are the three things we need to do predictably and reliably to get results from projects?
How project investments need to consider risk as well as investment.
What is the risk profile of projects?
How can a project manager or sponsor benchmark project track records to determine the risk or probable success of projects?
![]()
Chapter 1
IT Projects Are Investments
It was the best of times, it was the worst of times.
—Charles Dickens
Chinese symbol for crisis: opportunity + danger.
—Traditional interpretation
IT is the source of much of the productivity growth in business over the last 20 years.1 That’s the good news. The bad news for businesses and other organizations is that productivity is not growing as fast as it did.
As competition increases through globalization, innovation, outsourcing, and even changes in the global financial system, the competitive edge goes to organizations that manage projects effectively.
Why? Because projects are the means to introduce change.
Success in a moving world is founded on the ability to change effectively even when the environment is turbulent.
Projects are a way of:
• Consciously identifying and introducing change;
• Defining a start and end, an intended result, and a set of assigned resources;
• Tracking investments in change and holding people accountable for those results.
CIOs are aware of the problem—many track projects closely. They introduce software delivery performance improvement processes like CMMI, ITIL, or Six Sigma—inspired processes. They hire experienced project managers. They invest in PPM systems.
Experienced PMs report that a “good” project is one that is on time, with slight budget overrun and functional shortfall.
This is not enough for sustained business results.
A project is an investment to achieve a return, a result, such as keeping the business operating, meeting regulatory needs and deadlines, or building a strategic capacity for a business unit.
In the investment world, returns are associated with risks. These risks require management for capital preservation and positive returns. Managing the risks to returns is as critical in projects as it is the investment world.
Effective projects generate results—a capacity needs to be used, an idea or innovation adopted and acted upon, or people aligned and acting in a new direction. If this fails, results fail.
Those who actually measure their success rates are surprised with what they find internally even when they are familiar with well-known IT project statistics mentioned in the Introduction. When 93 percent of projects underperform or are outright written off, any project that truly succeeds deserves celebration.
The real cost of failure is not talked about. The real rate of return is rarely calculated. The purpose of Productivity (Part 1) is to set a benchmark for the real productivity or ROI from our investments in technology and business change.
Chapter 2 benchmarks the real returns of three well-known IT project portfolios. Four actions to take to lift success rates and results are covered in Chapter 3. A pragmatic approach to calculating your own benchmark based on your project track record is covered in Chapter 4. The last chapter in this Part is a diagnostic for those wanting to see the track record of projects in their own organization—like a golfer’s PAR.
This chapter looks at productivity, failure, and opportunity. The big picture business issues.
Avoiding the failure rate simply means it is not dealt with. Few wish to raise such information to the executive committee or board. On the other hand, recognizing what the failure rate in the current track record costs the company (Part 1) and then being able to identify where to proactively act to address and improve the track record (Parts 2-5) has real business value.
Executives know it takes courage to call the issue. They may use a consultant or their own staff to evaluate the probable performance results of 10 of their top projects. They will get the data. They will address the projects that affect their lines of business. They don’t want failures or write-offs. They don’t want failure. They want Predictable, Accountable Results (PAR).
Successful projects help their business grow. Unsuccessful ones hinder growth.
Failure or success is predictable. IT project performance can be diagnosed from leading indicators in the same way that high blood pressure can predict a possible heart attack.
The Back Story on Productivity
Taking a very macro picture of productivity growth in business, in the last 30 years, technology and other corporate practices have transformed productivity in many countries.
To take just one country, the United States:
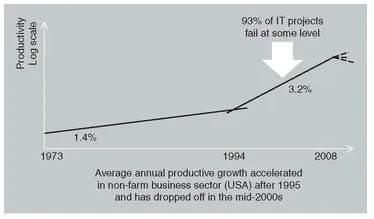
2 • 1973-1995: 1.4 percent productivity improvement;
• 1995-2003: 3.2 percent productivity improvement;
• 2004-: productivity has dropped.
This 3.2 percent annual productivity growth fueled the last business cycle.
Others3 demonstrate that the greatest gains in productivity have been in East Asia where it has doubled in a decade, which is interesting in these days of global competition and supply chains.
The U.S. Department of Commerce attributes North American improvements primarily to technology. Others also give credit to rising levels of M&A, to labor arbitrage via outsourcing4 and offshoring. The International Labor Organization5 finds that increases in productivity in the last 10 years are primarily the result of firms better combining capital, labor, and technology.
It’s technology, but it is not just technology that gets better results.6
The Productivity Challenge and IT
In practice, productivity improves when there are more successful changes than unsuccessful.
The reality is that the net sum is just barely positive.
The 3.2 percent annual growth in productivity attributed to technology in Figure 1.1 below sounds good until you recall the failure rate statistics of up to 93 percent7 of projects failing at some level.
FIGURE 1.1 The Productivity Challenge
This productivity growth is underperforming. Improving the results from projects is a real source of competitive advantage. Executives in companies large and small, domestic and international, talk of their frustrations when introducing change to improve productivity and results.
CEOs Say They Cannot Continue to Introduce Change in the Same Way
CEOs see significant change ahead, but the gap between expected change and the ability to manage it has almost tripled.8
Globally, IT executives know this9 as they report that initiatives frequently fail to make a positive impact on the business as Table 1.1 shows.
This is a sizable business problem.
TABLE 1.1
IT Executives Belief in the Impact of Projects on Business
| Region | % Believing that 25% or More of Projects Failed to Make a Positive Impact on the Business |
|---|
| Europe | 40% |
| Americas | 30% |
| Asia | Over 50% |
• CIOs and IT get credit for honesty. These figures are not palatable to the business. They do make it clear that good results are rarer than is publicly acknowledged. The need for a broader approach to managing the risks to achieving business results is clear.10
Productivity growth requires IT and business to deliver results together.
Sidebar: Success Depends on Your Perspective
Many providers of IT services—software houses or independent developers—say, “We don’t fail like that. I don’t understand where they get their statistics from.” IT service providers are looking at project results from a different point of view.
Success as a service provider means:
• Functional changes and associated budget variations are agreed.
• The customer accepted the work and paid for it promptly.
• The customer recomme...