![]()
Part I
Foundations
![]()
1
Basic Instruments
Concentrate all your thoughts on the task at hand. The sun’s rays do not burn until brought to a focus.
Alexander Graham Bell
1.1 INTRODUCTION
We begin the book by first reviewing the basic set of financial instruments. These are either building blocks of derivatives or impact their valuation. A derivative is a financial instrument derived from another asset. It can also be derived from a set of events, an index or some condition, and in all cases we refer to these as the underlying asset(s) of the derivative. The set of financial instruments discussed in this introductory chapter fall into two categories: they are either exchange traded or over the counter. Exchange-traded products, also referred to as listed, are standardized products that are traded on an exchange which acts as the intermediary. Futures contracts are an example of exchange-traded contracts. Over-the-counter products, on the other hand, are privately agreed directly between two parties, without the involvement of an exchange. This includes almost all swaps and exotic derivatives.
We first look at interest rates and explain the differences between the various types. These include LIBOR, which is not only the most common floating rate used in swap agreements but also a reference rate that can be used to compute the present value of a future amount of money. We also introduce the different discounting methods, which are of prime importance in the valuation of derivatives. Within the topic of fixed income, we define the essential debt instruments known as zero coupon bonds.
This chapter also provides the basics of equity and currency markets. The features of stocks are defined as well as the parameters impacting their future price. We discuss how a currency can be viewed as a stock asset; we then define the importance and uses of indices and exchange-traded funds in trading strategies. Forward and futures contracts are also described in this chapter.
To round out the review of financial instruments we discuss swaps, which are agreements that occupy a central and crucial position in the over-the-counter market; the most commonly traded swap being the interest rate swap. After defining swaps’ features and trading purposes, we introduce cross-currency swaps that are used to transform a loan from one currency to another. Finally, we present the features of total return swaps, which can replicate the performances of assets such as equities or bonds.
1.2 INTEREST RATES
Interest rates represent the premium that has to be paid by a borrower to a lender. This amount of money depends on the credit risk - that is, the risk of loss due to a debtor’s non-payment of his duty, on the interest and/or the principal, to the lender as promised. Therefore, the higher the credit risk, the higher the interest rates charged by the lender as compensation for bearing this risk.
Interest rates play a key role in the valuation of all kinds of financial instruments, specifically, interest rates are involved to a large extent in the pricing of all derivatives. For any given currency, there are many types of rates that are quoted and traded. Therefore, it is important to understand the differences between these rates and the implications of each on the valuation of financial instruments.
1.2.1 LIBOR vs Treasury Rates
Among the more popular rates, we find Treasury rates and LIBOR rates. Treasury rates are the rates earned from bills or bonds issued by governments. Depending on the issuing sovereign body, these can be considered as risk-free rates since it is assumed that certain governments will not default on their obligations. However, derivatives traders may use LIBOR rates as short-term risk-free rates instead of Treasury rates.
The London Interbank Offered Rate (LIBOR) is the interest rate at which a bank offers to lend funds to other banks in the interbank market. LIBOR rates can have different maturities corresponding to the length of deposits and are associated with all major currencies. For instance, 3-month EURIBOR is the rate at which 3-month deposits in euros are offered; 12-month US LIBOR is the rate at which 12-month deposits in US dollars are offered; and so on. LIBOR will be slightly higher than the London Interbank Bid Rate (LIBID), which is the rate at which banks will accept deposits from other financial institutions.
Typically, a bank must have an AA credit rating (the best credit rating given by the rating agency Standard and Poor’s being AAA) to be able to accept deposits at the LIBOR rate. A rating as such would imply that there is a small probability that the bank defaults. This is why LIBOR rates are considered to be risk free although they are not totally free of credit risk. Moreover, a number of regulatory issues can impact the value of Treasury rates and cause them to be consistently low. For this reason, LIBOR is considered by derivatives traders to be a better measurement of short-term risk-free rates than Treasury rates. In the world of derivatives, people think directly of LIBOR rates when talking about risk-free rates.
The difference between the interest rate of 3-month Treasury bills and the 3-month LIBOR is known as the TED spread, and can be used as a measure of liquidity in interbank lending. LIBOR, which corresponds to interbank lending, compared to the risk-free rates of Treasury bills is an indication of how willing banks are to lend money to each other. LIBOR rates involve credit risk, whereas Treasury rates do not, and thus the TED spread serves as a measure of credit risk in the interbank market. Higher TED spreads correspond to higher perceived risks in lending, and vice versa.
1.2.2 Yield Curves
For any major currency, the interest rates paid on bonds, swaps or futures are closely watched by traders and plotted on a graph against their maturities. These graphs are commonly called yield curves and they emphasize the relationship between interest rates and maturity for a specific debt in a given currency. The points on the curve are only known with certainty for specific maturity dates; the rest of the curve is built by interpolating these points.
For each currency, there are several types of yield curves describing the cost of money depending on the creditworthiness of debtors. The yield curves showing interest rates earned by the holders of bonds issued by governments are called government bond yield curves. Besides these curves, there are corporate curves that correspond to the yields of bonds issued by companies. Because of a higher credit risk, the yields plotted in corporate curves are usually higher and are often quoted in terms of a credit spread over the relevant LIBOR curve. For instance, the 10-year yield curve point for Renault might be quoted as LIBOR + 75 bp (a basis point or bp being equal to 0.01%), where 75 bp is the credit spread. In order to price a financial instrument, a trader will choose the yield curve that corresponds to the type of debt associated with this instrument. Despite there being different time-periods corresponding to the various rates, they are typically expressed as an annual rate. This allows interest rates to be compared easily.
Yield curves are typically upwards sloping, with longer term rates higher than shorter term rates. However, under different market scenarios the yield curve can take several different shapes, being humped or possibly downward sloping. We go into much further detail regarding the shapes of yield curves when we discuss interest rates in the context of hybrid derivatives in Chapter 17. Credit spreads are also discussed in more detail in Chapter 18 in the context of defaultable bonds and credit derivatives.
1.2.3 Time Value of Money
The concept of the time value of money is key to all of finance, and is directly related to interest rates. Simply put, an investor would rather take possession of an amount of money today, for example $1,000, than take hold of the $1,000 in a year, 10 years, or even one week. In fact, the concept of interest over an infinitesimally small period arises, and the preference is that an investor would rather have the money now than at any point in the future. The reason is that interest can be earned on this money, and receiving the exact same amount of money at a time in the future is a forfeited gain.
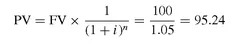
One hundred dollars to be paid one year from now (a future value), at an expected rate of return of
i = 5% per year, for example, is worth in today’s money, i.e. the
present value:
So the present value of 100 dollars one year from now at 5% is $95.24. In the above equation n = 1 is the number of periods over which we are compounding the interest. An important note is that the rate i is the interest rate for the relevant period. In this example we have an annual rate applied over a 1-year period. Compounding can be thought of as applying the interest rate to one period and reinvesting the result for another period, and so on.
To correctly use interest rates we must convert a rate to apply to the period over which we want to compute the present value of money. Interest rates can be converted to an equivalent continuous compounded interest rate because it is computationally easier to use. We can think of this as compounding interest over an infinitesimally small period. The present value, PV, at time 0 of a payment at time
t in the future, is given in terms of the future value, FV, and the continuously compounded interest rate
r by
Exercise
Consider you make a deposit of $100 today. Let’s assume that interest rates are constant ...