Nils Rasmussen (West Hollywood, CA) is cofounder and Principal of Solver, Inc. Claire Y. Chen (Long Beach, CA) is a Senior Business Intelligence Architect at Solver, Inc. Manish Bansal (Irvine, CA) is Vice President of Sales at Solver, Inc.
eBook - ePub
Business Dashboards
A Visual Catalog for Design and Deployment
- English
- ePUB (mobile friendly)
- Available on iOS & Android
eBook - ePub
Business Dashboards
A Visual Catalog for Design and Deployment
About this book
Focusing on designing the right dashboards for use in an organization, this timely, full color book reveals how to successfully deploy dashboards by building the optimal software architecture and dashboard design. In addition, it describes the value of this popular technology to a business and how it can have a significant impact on performance improvement. A unique collection of more than 120 dashboard images are organized by category. One of the chapters provides a step-by-step description of the key performance indicator (KPIs) design process. One of the appendices contains more than 1,000 examples of KPIs to help design the content of dashboards. The book also describes all the steps in a dashboard implementation and offers related advice.
Trusted by 375,005 students
Access to over 1.5 million titles for a fair monthly price.
Study more efficiently using our study tools.
PART 1
INTRODUCTION TO DASHBOARDS
The inspiration for this book stemmed from the surge in demand from companies and government organizations for dashboards that will empower their employees to optimize performance management. Our goal is to provide practical and high value-added content based on three underlying principles:
1. The power of process. It is much easier for a project team to go through an implementation when there is a structured process in place. Everywhere possible in this book, we provide step-by-step tools that can be used in a real-world implementation.
2. The power of examples. This book provides a large number of dashboard examples in order to give the project team and other managers as many ideas as possible for their own dashboard projects.
3. The critical essence of good data architecture. The authors propose that organizations need to deploy a solid and carefully planned data architecture to support sustainable and successful dashboards.
During customer engagements, we have experienced time and again that what can start out as a small project to implement a dashboard for one department within a company often causes a snowball effect and “I want a dashboard too” attitudes when other departments see the completed dashboard in action. Of course that means that along the way we proved to the information technology (IT) group that we could extract data from various source databases, and we proved to the end users that we could transform that data into useful metrics and present it in a user-friendly and attractive dashboard. Because both the data architecture and the dashboard’s content and functionality are critical success factors to any implementation project, we cover each in detail in this book.
How should you read this book? If you are relatively new to the concept of dashboards and you do not have data extracted from source systems and ready to be used, we suggest you read this book from cover to cover. We have organized it so that it first informs you, then it provides real-world examples to give you ideas, and finally it guides you through the implementation project. If you already have a complete idea of the architecture, the desired dashboard(s) or how to run your project, then we suggest you go directly to the applicable parts of the book.
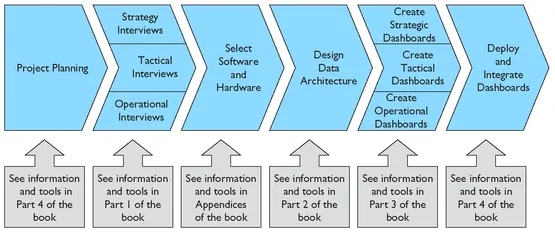
Exhibit P1.1 highlights the recommended workflow of a dashboard project along with related tools and advice found in this book.
EXHIBIT P1.1 Dashboard Implementation Process
chapter 1
Dashboard Definition
If you drive a car or fly an aircraft, vital information about speed, oil pressure, temperature, and so on is available to you through the dashboard in front of you. Gauges, red and green lights, and odometers are strategically positioned so that with a quick glance, without losing focus on where you are going, you know if everything is okay (or not) and can make decisions accordingly.
Just as drivers and pilots rely on their dashboards to do their jobs, managers today are increasingly turning to business dashboards to help them run their organizations. The ideas and benefits are very much the same as the example with the driver: Give managers a dashboard that on one well-designed screen shows the key information they need to monitor the items they are responsible for, and then they can quickly discover problems and take action to help improve the performance of their organizations.
Although this book is focused on the topic of business dashboards, it is good to have an understanding of the broader area of business intelligence (BI) software because they are closely related. BI software first arrived on the market in the late 1980s labeled as Executive Information Systems. They promised senior-level managers colorful, graphical screens with big buttons to make it easy for a nontechnical executive to see what was going on within the company. The major problem at that time was that data was not readily available because of proprietary databases (or simply no database at all) and lack of good extraction, transformation, and loading (ETL) tools to get data from the source and into the dashboard in an automated and meaningful way. It was not until the early 21st century that databases, ETL tools, and dashboard software had matured to a level that made sustainable, organization-wide dashboards a realistic possibility.
The term business intelligence was coined in 1989 by Howard Dresner, a research analyst at the Gartner Group. He popularized “business intelligence” as a broad term to describe a set of concepts and methods to improve business decision making by using fact-based support systems. Performance management is built on a foundation of BI but marries it to the planning and control cycle of the enterprise—with enterprise planning, consolidation, and modeling capabilities.
Since around 2005, BI software has been one of the fastest growing business software technologies in the world. As more and more users, vendors, and industry analysts have focused in on BI, a number of interchangeable or overlapping terms have been introduced. A more narrow area of BI is business performance management; the following definition emerged in 2003:
Business performance management is a framework for organizing, automating and analyzing business methodologies, metrics, processes and systems that drive business performance.1
In other words, business performance management (BPM or Corporate performance management, Enterprise performance management, or Operational performance management) is a set of processes that helps organizations optimize their business performance. In this book we will mostly use the term Business Intelligence (BI) and we will categorize dashboarding as a part of BI. Most people agree that the area of BI includes the following processes and related technologies:
• Budgeting
• Forecasting
• Reporting
• Strategic planning
• Scorecarding
• Analysis
• Dashboarding
• Data mining
• Data warehousing
In summary, BI helps businesses make efficient use of their financial, human, material, and other resources. Good executives have always sought to drive strategy down and across their organizations, but without proper decision support systems they have struggled to transform strategies into actionable metrics. In addition, they have grappled with meaningful analysis to expose the cause-and-effect relationships that, if understood, could give valuable insight for their operational decision makers.
BI software and related methods allow a systematic, integrated approach that links enterprise strategy to core processes and activities. “Running by the numbers” now means something in the form of planning, budgeting, reporting, dashboarding, and analysis and can give the measurements that empower management decisions. When properly implemented, these systems and processes also motivate information workers to support organizational objectives by giving them actionable tools, objectives, and information.
Data warehouses and Online Analytical Processing (OLAP) (see Part 2 for more detail) are two of the fundamental technologies that have supported the adaptation and long-term success of modern dashboards. Whereas the data warehouse gathers, organizes, and stores information from various internal and external data sources, OLAP adds business logic to data by calculating and aggregating it. Together, these two technologies allow a dashboard to
• Display data that originally came from many sources
• Display metrics that are the result of simple or complex calculations
• Quickly provide new information on the screen, with minimal processing time
• Offer drill down from summary data to detailed transactions
For managers, dashboarding is now perhaps the most popular area of their BI strategy, and after about 20 years of evolution in BI software and related technologies, this business tool is coming of age.
Finally, just as there has been an evolution in the equipment available in a car’s dashboard, there has been an evolution driving business dashboard technology. Whereas the first dashboards predominantly were a set of “cool” charts and indicators placed on a single screen or piece of paper, today’s dashboards are increasingly more versatile (see Exhibit 1.1).
EXHIBIT 1.1 Evolution of Automobile Dashboards versus Business Dashboards
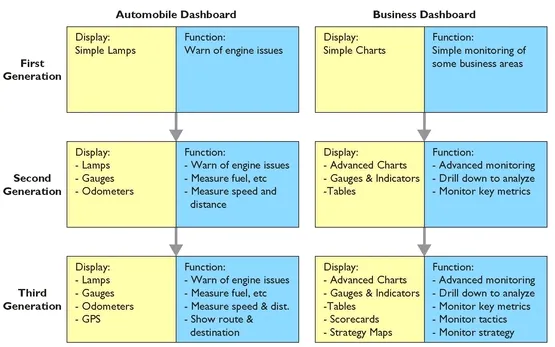
Automobile dashboards are now starting to include GPS (geographic positioning system) screens. Drivers not only know how fast they are going and how much gas is left; they can also plot the destination, select a route, and monitor the course on the GPS screen. Just like an organization’s strategy and tactics, the GPS allows drivers to have a structured plan for where they are going and how they are getting there. Along the same lines, many of today’s business dashboards can include strategy maps and scorecards, thereby integrating the monitoring of strategy and tactics along with the other analysis provided by the dashboard, so that at any point in time an information worker can stay on course.
This book is focused on how to successfully deploy dashbo...
Table of contents
- Title Page
- Copyright Page
- Preface
- Book Summary
- PART 1 - INTRODUCTION TO DASHBOARDS
- PART 2 - CREATING THE RIGHT BUSINESS INTELLIGENCE ARCHITECTURE FOR DASHBOARDS
- PART 3 - DASHBOARD DESIGN
- PART 4 - MANAGING A DASHBOARD PROJECT
- APPENDICES
- appendix A - Software Selection Tips
- appendix B - Installation
- appendix C - Hardware Recommendations
- appendix D - Security Authentication Techniques
- appendix E - Metrics and Key Performance Indicator Examples
- About the Authors
- Index
Frequently asked questions
Yes, you can cancel anytime from the Subscription tab in your account settings on the Perlego website. Your subscription will stay active until the end of your current billing period. Learn how to cancel your subscription
No, books cannot be downloaded as external files, such as PDFs, for use outside of Perlego. However, you can download books within the Perlego app for offline reading on mobile or tablet. Learn how to download books offline
Perlego offers two plans: Essential and Complete
- Essential is ideal for learners and professionals who enjoy exploring a wide range of subjects. Access the Essential Library with 800,000+ trusted titles and best-sellers across business, personal growth, and the humanities. Includes unlimited reading time and Standard Read Aloud voice.
- Complete: Perfect for advanced learners and researchers needing full, unrestricted access. Unlock 1.5M+ books across hundreds of subjects, including academic and specialized titles. The Complete Plan also includes advanced features like Premium Read Aloud and Research Assistant.
We are an online textbook subscription service, where you can get access to an entire online library for less than the price of a single book per month. With over 1.5 million books across 990+ topics, we’ve got you covered! Learn about our mission
Look out for the read-aloud symbol on your next book to see if you can listen to it. The read-aloud tool reads text aloud for you, highlighting the text as it is being read. You can pause it, speed it up and slow it down. Learn more about Read Aloud
Yes! You can use the Perlego app on both iOS and Android devices to read anytime, anywhere — even offline. Perfect for commutes or when you’re on the go.
Please note we cannot support devices running on iOS 13 and Android 7 or earlier. Learn more about using the app
Please note we cannot support devices running on iOS 13 and Android 7 or earlier. Learn more about using the app
Yes, you can access Business Dashboards by Nils H. Rasmussen,Manish Bansal,Claire Y. Chen in PDF and/or ePUB format, as well as other popular books in Business & Business Strategy. We have over 1.5 million books available in our catalogue for you to explore.