Praise for INTERMARKET ANALYSIS
"John Murphy has done it again. He dissects the global relationships between equities, bonds, currencies, and commodities like no one else can, and lays out an irrefutable case for intermarket analysis in plain English. This book is a must-read for all serious traders."
-Louis B. Mendelsohn, creator of VantagePoint Intermarket Analysis software
"John Murphy's Intermarket Analysis should be on the desk of every trader and investor if they want to be positioned in the right markets at the right time."
-Thom Hartle, President, Market Analytics, Inc. (www.thomhartle.com)
"This book is full of valuable information. As a daily practitioner of intermarket analysis, I thought I knew most aspects of this invaluable subject, but this book gave me several new ideas. I thoroughly recommend it for beginners and professionals."
-Martin Pring, President of Pring.com and editor of the Intermarket Review Newsletter
"Mr. Murphy's Intermarket Analysis is truly the most efficient and unambiguous way to define economic and fundamental relationships as they unfold in the market. It cuts through all of the conflicting economic news/views expressed each day to provide a clear picture of the 'here and now' in the global marketplace."
-Dennis Hynes, Managing Director, R. W. Pressprich
"Master Murphy is back with the quintessential look at intermarket analysis. The complex relationships among financial instruments have never been more important, and this book brings it all into focus. This is an essential read for all investors."
-Andrew Bekoff, Technical Strategist, VDM NYSE Specialists
"John Murphy is a legend in technical analysis, and a master at explaining precisely how the major markets impact each other. This updated version provides even more lessons from the past, plus fresh insights on current market trends."
-Price Headley, BigTrends.com, author of Big Trends in Trading
- English
- ePUB (mobile friendly)
- Available on iOS & Android
eBook - ePub
CHAPTER 1
A Review of the 1980s
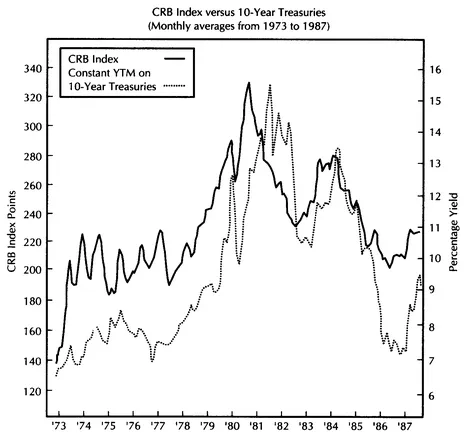
To fully understand the dramatic turns in the financial markets that started in 1980, it’s necessary to know something about the 1970s. That decade witnessed a virtual explosion in commodity markets, which led to spiraling inflation and rising interest rates. From 1971 to 1980, the Commodity Research Bureau (CRB) Index—which is a basket of commodity prices—appreciated in value by 250 percent. Bond yields rose by 150 percent during the same period and, as a result, bond prices declined. Figure 1.1 shows the close correlation between the CRB Index and the yield on 10-year Treasuries between 1973 and 1987. Long-term rates rose with commodities during the inflationary 1970s and fell with them during the disinflationary 1980s.
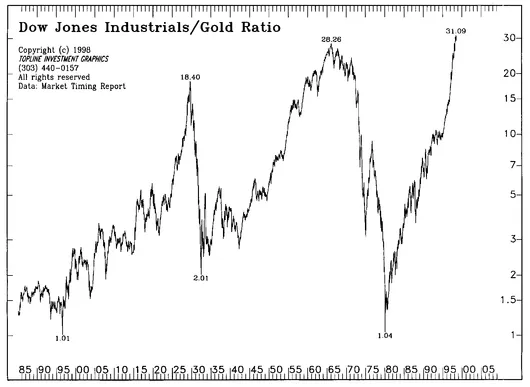
The 1970s were not good for stocks, either. The Dow Jones Industrial Average started the decade near 1,000 and ended the decade at about the same level. In the middle of that 10-year period of stock market stagnation, the Dow lost almost half its value. The 1970s were a decade for tangible assets; paper assets were out of favor. By the end of the decade, gold prices had soared to over $700 per ounce. A weak dollar during that period also contributed to the upward spiral in gold and other commodity prices—as well as the relative weakness in bonds and stocks. All this started to change in 1980, when the bubble burst in the commodity markets. Figure 1.2 is a ratio of the Dow Industrials divided by the gold market. The plunge in this ratio during the 1970s reflected the superior performance by gold and other hard assets in that inflationary decade. The ratio bottomed in 1980 after gold peaked. The Dow then bottomed in 1982.
FIGURE 1.1 A demonstration of the positive correlation between the CRB index and 10-year Treasury yields from 1973 to 1987.
COMMODITIES PEAK IN 1980
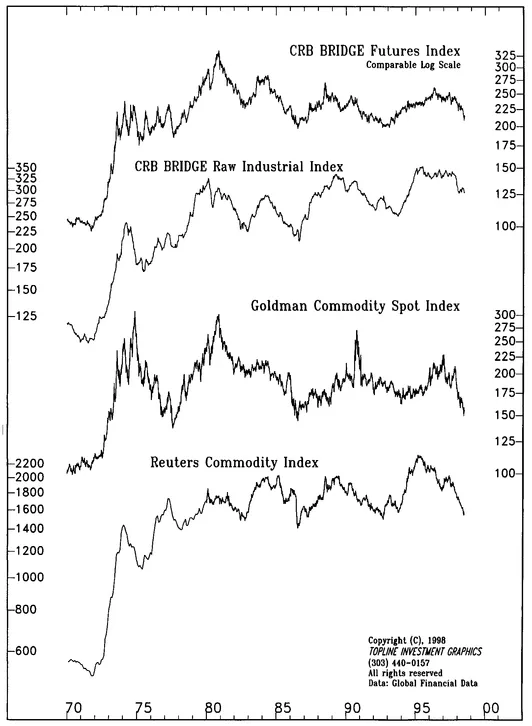
In late 1980, the bubble in commodity prices suddenly burst. The CRB Index started to fall from a record level of 330 points—and began a 20-year decline during which it lost half of its value. During these same 20 years, gold prices fell from $700 to $250, losing over 60 percent of their value. (It was not until after the stock market peak in 2000 that gold prices started to show signs that their twenty-year bear hibernation had ended.) The 1980 peak in commodity markets ended the inflationary spiral of the 1970s and ushered in an era of falling inflation (or disinflation) that lasted until the end of the twentieth century. Figure 1.3 shows the dramatic rally in a number of commodity indexes during the 1970s and the major peak that occurred in 1980. Commodity prices declined for the next 20 years. Another financial market made a big turn in 1980 that had a lot to do with the big peak in commodities : the U.S. dollar.
FIGURE 1.2 The plunge in the ratio during the 1970s reflected the superior performance of gold during that inflationary decade.
DOLLAR BOTTOMS IN 1980
The U.S. dollar hit a major bottom in 1980 and doubled in price over the next five years. One of the key intermarket relationships involved is the inverse relationship between commodity prices and the U.S. dollar. A falling dollar is inflationary in nature, and usually coincides with rising commodity prices (especially gold). A rising dollar has the opposite effect and is bearish for commodities and gold. This is why the significant upturn in the U.S. currency in 1980 was such an important ingredient in the historic turn from hyperinflation to disinflation that characterized the next 20 years. (Starting in year 2002, a major decline in the U.S. dollar contributed to a major upturn in gold and other commodities.)
FIGURE 1.3 A number of commodities indexes show the dramatic rally during the 1 970s and the major commodity peak during 1980.
BONDS BOTTOM IN 1981
Another key intermarket relationship has to do with bond and commodity prices. They trend in opposite directions. Rising commodity prices (like those seen in the 1970s) signal rising inflation pressure, which puts upward pressure on interest rates and downward pressure on bond prices. (Bond prices and bond yields trend in opposite directions.) Commodity prices often change direction ahead of bonds, which also makes them leading indicators of bonds at important turning points. At the start of the 1980s, it took a year for the drop in commodities to push the bond market higher.
During the second half of 1981, bond yields peaked near 15 percent. They fell to half that level (7 percent) within five years, which caused a major upturn in bond prices. The tide had turned. The stock market, which had been held back for a decade by rising interest rates, soon got an enormous boost from falling bond yields (and rising bond prices).
STOCKS BOTTOM IN 1982
During the summer of 1982, within a year of the bond market bottom, the biggest bull run in stock market history started—and lasted for almost two decades. The fact that the bond market bottomed ahead of stocks is also part of the normal pattern. The bond market has a history of turning ahead of stocks and is therefore viewed as a leading indicator of the stock market. The intermarket scenario had completely reversed itself at the start of the 1980s. Hard assets (like commodities) were in decline, while paper assets (bonds and stocks) were back in favor.
This turning point was one of the clearest examples of how intermarket relationships play out. Notice that four different market groups were involved : currencies, commodities, bonds, and stocks. All four played a major role as the inflationary 1970s ended and the disinflationary 1980s began. Let’s review the groundrules for how the financial markets normally interact with each other, which form the basis for our intermarket work.
HOW THE FOUR MARKET GROUPS INTERRELATE
Intermarket analysis involves the simultaneous analysis of the four financial markets—currencies, commodities, bonds, and stocks. It is how these four markets interact with each other that gives them their predictive value. Here is how they interrelate:
• The U.S. dollar trends in the opposite direction of commodities
• A falling dollar is bullish for commodities; a rising dollar is bearish
• Commodities trend in the opposite direction of bond prices
• Therefore, commodities trend in the same direction as interest rates
• Rising commodities coincide with rising interest rates and falling bond prices
• Falling commodities coincide with falling interest rates and rising bond prices
• Bond prices normally trend in the same direction as stock prices
• Rising bond prices are normally good for stocks; falling bond prices are bad
• Therefore, falling interest rates are normally good for stocks; rising rates are bad
• The bond market, however, normally changes direction ahead of stocks
• A rising dollar is good for U.S. stocks and bonds; a falling dollar can be bad
• A falling dollar is bad for bonds and stocks when commodities are rising
• During a deflation (which is relatively rare), bond prices rise while stocks fall
The list sums up the key intermarket relationships between the four market groups—at least as they are in a normal inflationary or disinflationary environment, the likes of which existed during the second half of the last century. This held up especially well during the 1970s, the 1980s, and most of the 1990s. (The last item in the preceding list which refers to deflation was not normal in the postwar era. Later in the book I explain how deflationary pressures starting in 1997 and 1998 changed the normal relationship that had existed between bonds and stocks.) With a basic understanding of intermarket relationships, it is easier to see how well the markets followed that script at the start of the 1980s. A rising dollar led to falling commodities, which led to rising bond prices, which led to rising stock prices. Things stayed pretty much this way until 1987.
1987 STOCK MARKET CRASH REVISITED
The stock market crash during the second half of 1987 was an even more dramatic example of the necessity for intermarket awareness. It happened swiftly and the results were dramatic and painful. Those who ignored the action in related markets during the first half of that year were blindsided by the market collapse during the second half. As a result, they sought out scapegoats like program trading and portfolio insurance (futures-related strategies that can exaggerate stock market declines) to explain the carnage. While these two factors no doubt added to the steepness of the stock market decline, they did not cause it. The real explanation for the stock market crash that year is much easier to explain, but only if viewed from an intermarket perspective. It started in the bond and commodity pits in the spring of that year.
COMMODITIES RISE, BONDS FALL DURING SPRING OF 1987
During the four years after 1982, two of the main supporting factors behind the stock market advance were falling commodity prices (low inflation) and rising bond prices (falling interest rates). In 1986, both of those markets started to level off; commodities stopped going down and bond prices stopped going up. The intermarket picture did not really turn dangerous, however, until the spring of 1987. In April of that year, the CRB Index of commodity prices turned sharply higher and “broke out” to the highest level in a year. At the same time, bond prices went into a virtual freefall. (Rising commodity prices usually produce lower bond prices.) These intermarket trend changes removed two of the bullish props under the stock market advance and gave an early warning that the market rally was on weak footing. Figure 1.4 shows the inverse relationship between bond and commodity prices from 1985 to 1987. It shows the CRB Index rising above a neckline (a trendline drawn over previous peaks) in the spring of 1987 (which completed a bullish head and shoulders bottom) just as bond prices were falling under the lower trendline in a yearlong triangular pattern—a bad combination for stocks since it suggested that rising inflation was pushing interest rates higher.
STOCK MARKET PEAKS IN AUGUST
The stock market rally continued for another four months into August 1987 before finally peaking. The fact that bond prices peaked four months ahead of stocks demonstrates the tendency for bonds to turn ahead of stocks. Again, bonds are considered to be leading indicators of stocks. Figure 1.5 shows the divergence...
Table of contents
- Title Page
- Copyright Page
- Dedication
- Acknowledgments
- Introduction
- CHAPTER 1 - A Review of the 1980s
- CHAPTER 2 - 1990 and the First Persian Gulf War
- CHAPTER 3 - The Stealth Bear Market of 1994
- CHAPTER 4 - The 1997 Asian Currency Crisis and Deflation
- CHAPTER 5 - 1999 Intermarket Trends Leading to Market Top
- CHAPTER 6 - Review of Intermarket Principles
- CHAPTER 7 - The Nasdaq Bubble Bursts in 2000
- CHAPTER 8 - Intermarket Picture in Spring 2003
- CHAPTER 9 - Falling Dollar During 2002 Boosts Commodities
- CHAPTER 10 - Shifting from Paper to Hard Assets
- CHAPTER 11 - Futures Markets and Asset Allocation
- CHAPTER 12 - Intermarket Analysis and the Business Cycle
- CHAPTER 13 - The Impact of the Business Cycle on Market Sectors
- CHAPTER 14 - Diversifying with Real Estate
- CHAPTER 15 - Thinking Globally
- Appendix
- Index
Frequently asked questions
Yes, you can cancel anytime from the Subscription tab in your account settings on the Perlego website. Your subscription will stay active until the end of your current billing period. Learn how to cancel your subscription
No, books cannot be downloaded as external files, such as PDFs, for use outside of Perlego. However, you can download books within the Perlego app for offline reading on mobile or tablet. Learn how to download books offline
Perlego offers two plans: Essential and Complete
- Essential is ideal for learners and professionals who enjoy exploring a wide range of subjects. Access the Essential Library with 800,000+ trusted titles and best-sellers across business, personal growth, and the humanities. Includes unlimited reading time and Standard Read Aloud voice.
- Complete: Perfect for advanced learners and researchers needing full, unrestricted access. Unlock 1.5M+ books across hundreds of subjects, including academic and specialized titles. The Complete Plan also includes advanced features like Premium Read Aloud and Research Assistant.
We are an online textbook subscription service, where you can get access to an entire online library for less than the price of a single book per month. With over 1.5 million books across 990+ topics, we’ve got you covered! Learn about our mission
Look out for the read-aloud symbol on your next book to see if you can listen to it. The read-aloud tool reads text aloud for you, highlighting the text as it is being read. You can pause it, speed it up and slow it down. Learn more about Read Aloud
Yes! You can use the Perlego app on both iOS and Android devices to read anytime, anywhere — even offline. Perfect for commutes or when you’re on the go.
Please note we cannot support devices running on iOS 13 and Android 7 or earlier. Learn more about using the app
Please note we cannot support devices running on iOS 13 and Android 7 or earlier. Learn more about using the app
Yes, you can access Intermarket Analysis by John J. Murphy in PDF and/or ePUB format, as well as other popular books in Business & Finance. We have over 1.5 million books available in our catalogue for you to explore.