Knight's Microsoft Business Intelligence 24-Hour Trainer
eBook - ePub

Knight's Microsoft Business Intelligence 24-Hour Trainer

Leveraging Microsoft SQL Server Integration, Analysis, and Reporting Services with Excel and SharePoint

Brian Knight, Devin Knight, Adam Jorgensen, Patrick LeBlanc, Mike Davis

  1. English
  2. ePUB (mobile friendly)
  3. Available on iOS & Android
eBook - ePub

Knight's Microsoft Business Intelligence 24-Hour Trainer

Leveraging Microsoft SQL Server Integration, Analysis, and Reporting Services with Excel and SharePoint

Brian Knight, Devin Knight, Adam Jorgensen, Patrick LeBlanc, Mike Davis

Book details
Book preview
Table of contents
Citations

About This Book

A book-and-video introduction to Microsoft's Business Intelligence tools

If you are just starting to get a handle on Microsoft Business Intelligence (BI) tools, this book and accompanying video provides you with the just the right amount of information to perform basic business analysis and reporting. You'll explore the components and related tools that comprise the Microsoft BI toolset as well as the new BI features of Office 2010. After a basic primer on BI and data modeling, the expert team of authors provides you with step-by-step lessons in the book and videos on the accompanying DVD on how to use SQL Server Integration Services, SQL Server Analysis Services, SQL Server Reporting Services, Excel BI (including PowerPivot), and SharePoint.

  • Integrates instructional videos with each of the lessons found in the book to enhance your learning experience
  • Explores the Microsoft Business Intelligence (BI) toolset as well as the new BI features of Office 2010
  • Encourages you to practice what you've learned in "Try It Out" sections
  • Contains video demonstrations that walk you through how to tackle each lesson featured in the book

With Knight's Microsoft Business Intelligence 24-Hour Trainer, veteran authors present you with an ideal introductory book-and-video package so that you can get started working with the BI toolset immediately!

Note: As part of the print version of this title, video lessons are included on DVD. For e-book versions, video lessons can be accessed at wrox.com using a link provided in the interior of the e-book.

Frequently asked questions

How do I cancel my subscription?
Simply head over to the account section in settings and click on “Cancel Subscription” - it’s as simple as that. After you cancel, your membership will stay active for the remainder of the time you’ve paid for. Learn more here.
Can/how do I download books?
At the moment all of our mobile-responsive ePub books are available to download via the app. Most of our PDFs are also available to download and we're working on making the final remaining ones downloadable now. Learn more here.
What is the difference between the pricing plans?
Both plans give you full access to the library and all of Perlego’s features. The only differences are the price and subscription period: With the annual plan you’ll save around 30% compared to 12 months on the monthly plan.
What is Perlego?
We are an online textbook subscription service, where you can get access to an entire online library for less than the price of a single book per month. With over 1 million books across 1000+ topics, we’ve got you covered! Learn more here.
Do you support text-to-speech?
Look out for the read-aloud symbol on your next book to see if you can listen to it. The read-aloud tool reads text aloud for you, highlighting the text as it is being read. You can pause it, speed it up and slow it down. Learn more here.
Is Knight's Microsoft Business Intelligence 24-Hour Trainer an online PDF/ePUB?
Yes, you can access Knight's Microsoft Business Intelligence 24-Hour Trainer by Brian Knight, Devin Knight, Adam Jorgensen, Patrick LeBlanc, Mike Davis in PDF and/or ePUB format, as well as other popular books in Computer Science & Data Warehousing. We have over one million books available in our catalogue for you to explore.

Information

Publisher
Wrox
Year
2011
ISBN
9781118287477
Edition
1
Section IV: SQL Server Reporting Services
  • Lesson 21: Understanding SSRS
  • Lesson 22: Using Report Wizard
  • Lesson 23: Building a Matrix Report
  • Lesson 24: Parameterizing Your Reports
  • Lesson 25: Building Reports on Your Cube
  • Lesson 26: Using Maps in Your Report
  • Lesson 27: Building a Dashboard
  • Lesson 28: Deploying and Administering SSRS
  • Lesson 29: New Reporting Services Visualizations — Sparklines, Data Bars, and Indicators
  • Lesson 30: Using Report Builder
Chapter 21
Understanding SSRS
In any business it is important to be able to view your data. SQL Server Reporting Services (SSRS) gives developers the tools needed to show data to the end users in a report format that is easy to understand. An end user can be anyone in a company, from a secretary to the CEO. When the end users have good data presented in an easy-to-understand format, it allows them to make informed business decisions. Questions often asked in a corporate boardroom can be answered by good reports — questions like “Which customers are most likely to close their accounts?” “Should we be open on Saturday?” and “How much should we spend on advertising?” Just taking a stab in the dark with these questions can be the death of a company. Having the right data in front of the company’s decision-makers can avert costly mistakes.
Reports can also show predictions about whether profits will go up or down. This can help in determining staffing, in scheduling, and in predicting overhead cost. Predictions like this are based on algorithms built into tools like SQL Server Analysis Services. Reporting Services gives you a way to present these predictions in the form of tables, matrixes, maps, charts, and graphs. With these reports in hand, the end users will be confident they are making informed choices for the company.
As a report developer or a Business Intelligence consultant, you must create these reports. Therefore it is important to become familiar with the tools used in creating them. SQL Server Reporting Services 2008 R2 has many reporting tools to show the data. Before you get into showing the data to the users, you need to understand how to get this data into Reporting Services.
Some of the key concepts covered in this chapter include data sources, data sets, some of the Toolbox items, designing a basic table report, and finalizing reports. These concepts are the cornerstone of understanding and developing good reports in Reporting Services.
Building Your First Report
Assume your manager has asked you to build a report showing a list of your company’s products. This product data is held in your product table. The columns your manager wants on the report are Product ID, Name, Color, List Price, Standard Cost, Sell Start Date, and Sell End Date. She wants the report to have a header showing the report title and the date on which the report ran. She also wants a page footer showing the page number and total page count.
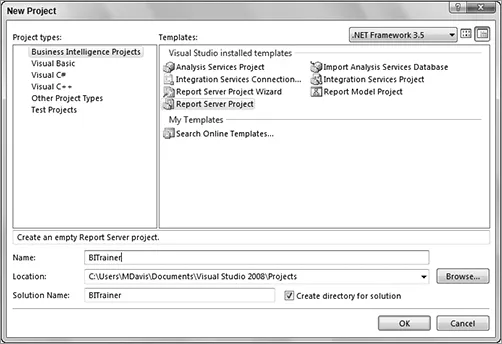
The first step is to open Business Intelligence Development Studio (BIDS) and create a report project. The shortcut to BIDS can be found in your Start menu under SQL Server 2008 R2. After opening BIDS you can click File and then New Project to bring up the New Project window seen in Figure 21-1. In the left-hand pane select Business Intelligence Projects. In the right-hand pane select Report Server Project. Enter a name for the project in the bottom of the New Project window and click OK. You have created a Report Server Project.
Figure 21-1
f2101.tif
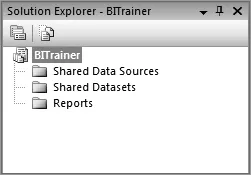
On the left-hand side of the screen you should see the Solution Explorer, as shown in Figure 21-2. If it is not visible, the window positions have been customized. The following chapters on Reporting Services will assume the windows in BIDS are in their default configuration. To reset the windows to their default positions you can click Reset Window Layout under the Window drop-down at the top of BIDS. You can also find the shortcut for many windows under the View menu, also at the top of BIDS.
Figure 21-2
f2102.tif
In the Solution Explorer you will find three folders:
  • Shared Data Sources
  • Shared Datasets
  • Reports
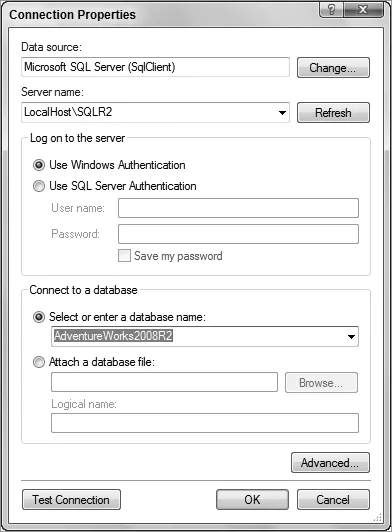
The first item you need to create is a shared data source. A shared data source contains the server name and the name of the database where the report will query data. To create a shared data source, right-click the Shared Data Sources folder and select Add New Data Source. In the Name box type in AW. This represents the Adventure Works database. Make sure the type is set to Microsoft SQL Server. Click Edit and then select the name of your server from the Server drop-down menu. Or you may want to type in the name of the server. The drop-down menu tends to take a long time to render the server list. In the Database Name box enter AdventureWorks2008R2. Your windows should look similar to what is shown in Figure 21-3. (The server name may be different.) AdventureWorks2008R2 is the free sample database from Microsoft. You can download this database from www.codeplex.com.
Figure 21-3
f2103.tif
The shared data set is a new feature added to SQL Server R2. A shared data set will contain a query or call a stored procedure to retrieve data from a data source. To create a shared data set right-click the Shared Datasets folder and select Add New Data Set. Give the data set the name Products. Ensure ...

Table of contents

Citation styles for Knight's Microsoft Business Intelligence 24-Hour Trainer

APA 6 Citation

Knight, B., Knight, D., Jorgensen, A., LeBlanc, P., & Davis, M. (2011). Knight’s Microsoft Business Intelligence 24-Hour Trainer (1st ed.). Wiley. Retrieved from https://www.perlego.com/book/1006842/knights-microsoft-business-intelligence-24hour-trainer-leveraging-microsoft-sql-server-integration-analysis-and-reporting-services-with-excel-and-sharepoint-pdf (Original work published 2011)

Chicago Citation

Knight, Brian, Devin Knight, Adam Jorgensen, Patrick LeBlanc, and Mike Davis. (2011) 2011. Knight’s Microsoft Business Intelligence 24-Hour Trainer. 1st ed. Wiley. https://www.perlego.com/book/1006842/knights-microsoft-business-intelligence-24hour-trainer-leveraging-microsoft-sql-server-integration-analysis-and-reporting-services-with-excel-and-sharepoint-pdf.

Harvard Citation

Knight, B. et al. (2011) Knight’s Microsoft Business Intelligence 24-Hour Trainer. 1st edn. Wiley. Available at: https://www.perlego.com/book/1006842/knights-microsoft-business-intelligence-24hour-trainer-leveraging-microsoft-sql-server-integration-analysis-and-reporting-services-with-excel-and-sharepoint-pdf (Accessed: 14 October 2022).

MLA 7 Citation

Knight, Brian et al. Knight’s Microsoft Business Intelligence 24-Hour Trainer. 1st ed. Wiley, 2011. Web. 14 Oct. 2022.