![]()
CHAPTER 1
WHY IS CHART ANALYSIS SO IMPORTANT?
Successful participation in the financial markets virtually demands some mastery of chart analysis. Consider the fact that all decisions in various markets are based, in one form or another, on a market forecast. Whether the market participant is a short-term trader or long-term investor, price forecasting is usually the first, most important step in the decision-making process. To accomplish that task, there are two methods of forecasting available to the market analyst—the fundamental and the technical.
Fundamental analysis is based on the traditional study of supply and demand factors that cause market prices to rise or fall. In financial markets, the fundamentalist would look at such things as corporate earnings, trade deficits, and changes in the money supply. The intention of this approach is to arrive at an estimate of the intrinsic value of a market in order to determine if the market is over- or under-valued.
Technical or chart analysis, by contrast, is based on the study of the market action itself. While fundamental analysis studies the reasons or causes for prices going up or down, technical analysis studies the effect, the price movement itself. That’s where the study of price charts comes in. Chart analysis is extremely useful in the price-forecasting process. Charting can be used by itself with no fundamental input, or in conjunction with fundamental information. Price forecasting, however, is only the first step in the decision-making process.
Market Timing
The second, and often the more difficult, step is market timing. For short-term traders, minor price moves can have a dramatic impact on trading performance. Therefore, the precise timing of entry and exit points is an indispensable aspect of any market commitment. To put it bluntly, timing is everything in the stock market. For reasons that will soon become apparent, timing is almost purely technical in nature. This being the case, it can be seen that the application of charting principles becomes absolutely essential at some point in the decision-making process. Having established its value, let’s take a look at charting theory itself.
![]()
CHAPTER 2
WHAT IS CHART ANALYSIS?
Chart analysis (also called technical analysis) is the study of market action, using price charts, to forecast future price direction. The cornerstone of the technical philosophy is the belief that all of the factors that influence market price—fundamental information, political events, natural disasters, and psychological factors—are quickly discounted in market activity. In other words, the impact of these external factors will quickly show up in some form of price movement, either up or down. Chart analysis, therefore, is simply a short-cut form of fundamental analysis.
Consider the following: A rising price reflects bullish fundamentals, where demand exceeds supply; falling prices would mean that supply exceeds demand, identifying a bearish fundamental situation. These shifts in the fundamental equation cause price changes, which are readily apparent on a price chart. The chartist is quickly able to profit from these price changes without necessarily knowing the specific reasons causing them. The chartist simply reasons that rising prices are indicative of a bullish fundamental situation and that falling prices reflect bearish fundamentals.
Another advantage of chart analysis is that the market price itself is usually a leading indicator of the known fundamentals. Chart action, therefore, can alert a fundamental analyst to the fact that something important is happening beneath the surface and encourage closer market analysis.
Charts Reveal Price Trends
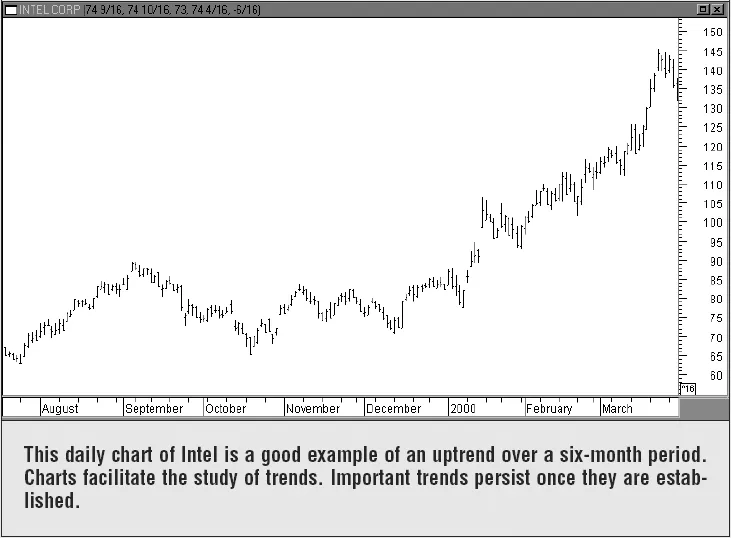
Markets move in trends. The major value of price charts is that they reveal the existence of market trends and greatly facilitate the study of those trends. Most of the techniques used by chartists are for the purpose of identifying significant trends, to help determine the probable extent of those trends, and to identify as early as possible when they are changing direction (See Figure 2-1).
Types of Charts Available
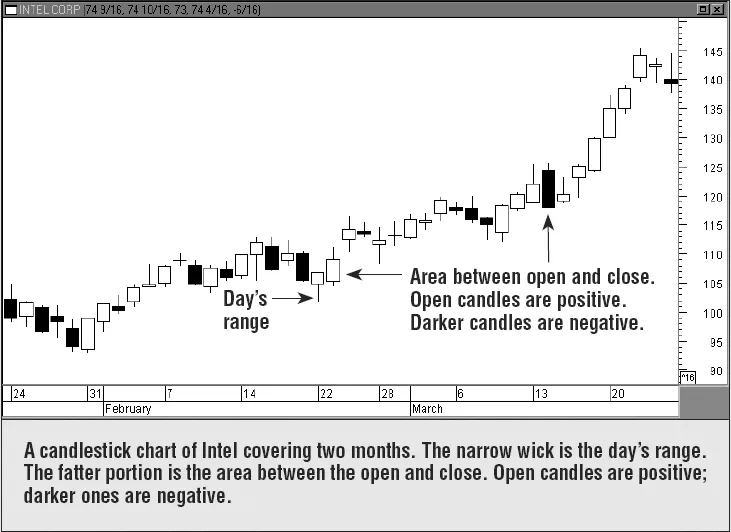
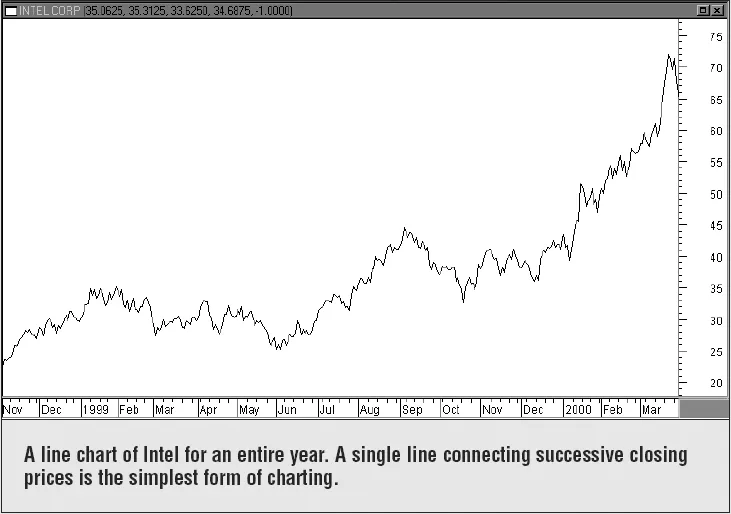
The most popular type of chart used by technical analysts is the daily bar chart (see Figure 2-1). Each bar represents one day of trading. Japanese candlestick charts have become popular in recent years (see Figure 2-2). Candlestick charts are used in the same way as bar charts, but present a more visual representation of the day’s trading. Line charts can also be employed (see Figure 2-3). The line chart simply connects each successive day’s closing prices and is the simplest form of charting.
Any Time Dimension
All of the above chart types can be employed for any time dimension. The daily chart, which is the most popular time period, is used to study price trends for the past year. For longer range trend analysis going back five or ten years, weekly and monthly charts can be employed. For short-term (or day-trading) purposes, intraday charts are most useful. [Intraday charts can be plotted for periods as short as 1-minute, 5-minute or 15-minute time periods.]
![]()
CHAPTER 3
HOW TO PLOT THE DAILY BAR CHART
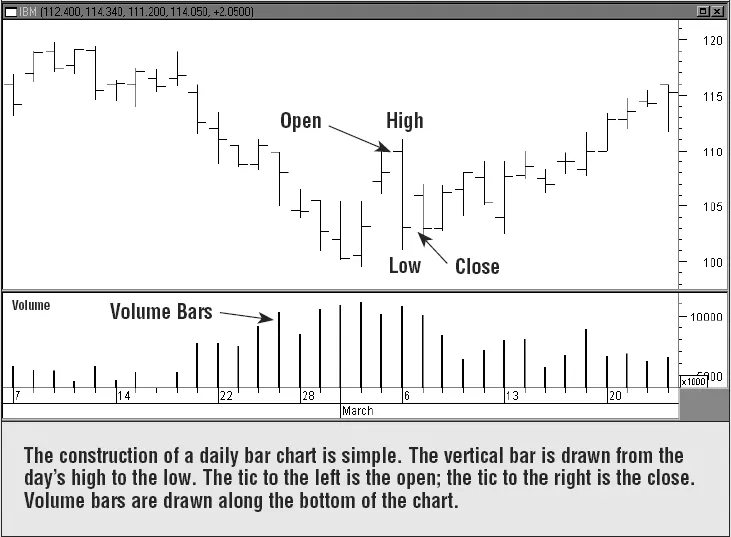
Price plotting is an extremely simple task. The daily bar chart has both a vertical and horizontal axis. The vertical axis (along the side of the chart) shows the price scale, while the horizontal axis (along the bottom of the chart) records calendar time. The first step in plotting a given day’s price data is to locate the correct calendar day. This is accomplished simply by looking at the calendar dates along the bottom of the chart. Plot the high, low, and closing (settlement) prices for the market. A vertical bar connects the high and low (the range). The closing price is recorded with a horizontal tic to the right of the bar. (Chartists mark the opening price with a tic to the left of the bar.) Each day simply move one step to the right. Volume is recorded with a vertical bar along the bottom of the chart (See Figure 3-1).
Charts...