![]()
PART One
The General Landscape of Distress Investing
![]()
CHAPTER 1
The Changed Environment
Three earthshaking events have resulted in a markedly changed financial environment since the late 1980s and early 1990s: first, financial innovation; second, new laws and regulations; third, the 2007-2008 financial meltdown. The past three decades have witnessed a tremendous amount of financial innovation that has led to significant changes in the levels of debt, the types of credit market instruments, and the overall capital structures of nonfinancial U.S. corporations. These changes accelerated after the late 1980s. Such innovation has also been responsible for the acceleration of the claims’ transformation process—loans into securities issued by structured investment vehicles (SIVs) like collateralized loan obligations (CLOs), for example—that has had important effects on the traditional roles of financial intermediaries and the creation of new credit markets.
After the 1999 Gramm-Leach-Bliley Act and prior to the 2008 financial meltdown, commercial banks tended to act more like underwriters and distributors than like financial intermediaries and investors. These banks no longer take the credit risks that they used to take in the 1970s and early 1980s, albeit they switched to instruments with vastly increased credit risk for their portfolios of consumer loans, including residential mortgages and consumer credit card debt. The development of securitization and financial derivatives markets has contributed to a major transfer of credit risk from commercial banks to other types of market participants, who have assumed active and growing functions in new markets for claims that were the traditional realm of regulated banks. New derivatives markets include credit default swaps (CDSs), which are bets, mostly by speculators, on the probabilities of money defaults on individual debt issues. Before the financial meltdown of 2007-2008, and even after, hedge funds speculated on the credit quality of an issuer using credit default swaps with very large amounts of leverage, and literally influenced market perceptions of the creditworthiness of issuers even though they might have been less knowledgeable than a bank or a credit rating agency making such assessments.
Another outcome of innovation was the development of new primary and secondary markets that have improved the liquidity for traditional and transformed claims. The creation of the original-issue below-investment-grade bond market in the 1980s and early 1990s and of the leveraged loan markets are but two examples of such transformation. With increased participation by nontraditional market participants, more liquid, efficient, and potentially unstable secondary markets have also developed. As an example of increased efficiency, back in early 1980s one could buy secured loans of distressed companies at about 40 cents on the dollar, whereas after the early 1990s and before the 2007-2008 financial meltdown one would have to pay 85 or 90 cents on the dollar for the same loans. As an example of the potential funding instability, almost 70 percent of the par value outstanding of leveraged loans is held by nonbank institutions like hedge funds, collateralized debt obligation (CDO) trusts, and the like.
Financial innovation has not been the only driver of change in the distress investment environment. The legal environment for reorganizations has also changed with the passage of the Bankruptcy Abuse Prevention and Consumer Protection Act of 2005 (BAPCPA), which made changes to the Bankruptcy Reform Act of 1978. Among the many changes with respect to business bankruptcy reorganizations, the 2005 Act has imposed new time limits on the debtor’s exclusive right to file a Plan of Reorganization (POR), has shortened the time period during which debtors can decide whether to assume or reject nonresidential real estate losses, has attempted to limit executive compensation paid under key employee retention plans (KERPs), and has enhanced the rights of trade vendors. The administrative costs of a Chapter 11 reorganization have become quite onerous to many estates, and as a consequence we see a larger number of prepackaged and/or prenegotiated filings today.
These are just a few of the important forces that have shaped and continue to shape today’s distress investment environment. In this chapter we try to give the reader a broad perspective on some of these trends and changes both during the period from 1990 up until 2007 and after the 2007-2008 financial crisis.
TRENDS IN CORPORATE DEBT GROWTH AND LEVERAGE BEFORE THE FINANCIAL MELTDOWN OF 2007-2008
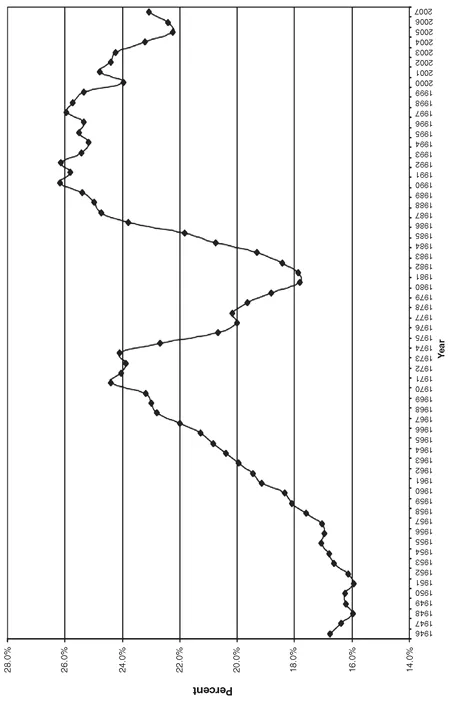
Over the past 60 years, U.S. nonfinancial corporate credit market debt outstanding grew, on average and in real terms, faster than the gross domestic product (GDP). Corporate debt grew at an annual real rate of 4.1 percent, whereas GDP grew at an annual real rate of 2.7 percent for the same period. Growth was volatile and generally tied to the business cycle (see
Exhibit 1.1),
EXHIBIT 1.1 Annual GDP Growth Rate versus Corporate Credit Market Growth Rate, 1946-2007
but in the last 30 years the credit cycle became considerably more volatile than it had been in the previous 30 years.
For the 1945-1969 period, the volatility of the real rate of growth in GDP and corporate debt measured by their standard deviations were 4.00 percent and 2.39 percent respectively, whereas comparable numbers for the 1970-2007 period were 2.37 percent and 4.45 percent. Today, larger credit contractions are associated with much shallower slowdowns than in the past. The increased levels of leverage used by corporations brought about this larger volatility in the corporate credit cycle. In 1979, credit market debt at nonfinancial corporations was only 17.8 percent of assets, but by the end of 1990 it had grown to represent 26.2 percent of assets, surpassing the previous high level of 24.4 percent in 1970 (see Exhibit 1.2).
Increased levels of leverage were made possible by easier access to credit markets, which in turn resulted in an overall deterioration of creditworthiness. Understanding how these new levels of leverage came about is quite important to understanding the current distress investing environment. At the heart of this change in financial leverage was an unprecedented amount of financial innovation and regulatory change.
JUNK BONDS AND THE LEVERING-UP PERIOD
The leveraged restructuring movement and the development and growth of the original-issue below-investment-grade bond market played a major role in the levering-up process of the 1980s. The highly successful going-private transaction of Gibson Greetings, Inc. in 1982 and the astonishingly quick placement of $1.3 billion of junk bonds for Metromedia in 1984 signaled the beginning of a trend. From 1984 to 1989, use of proceeds for share purchases accounted for more than 80 percent of the net issuance of corporate bonds and bank loans put together.1 Although below-investment-grade bonds had been around for a long time, a large proportion of the amount outstanding during the 1970s was investment-grade debt that had been downgraded to below investment grade—fallen angels—and represented only a small fraction of the total corporate bond debt outstanding.
Junk bonds are generally unsecured obligations (debentures), with covenants that are much less restrictive than those of bank loans. Primary offerings come to market either as registered issues or under the exemption of Rule 144A that allows public companies to issue quickly and avoid the delays of a public registration.2 Deals that do not have registration rights are usually exchanged for an identical series of registered paper, which enhances their liquidity. Typical holders of this paper include mutual funds, pension funds, insurance companies, collateralized debt obligation (CDO) structured vehicles, and hedge funds. Many of the junk bonds are subordinated issues that rank junior to senior unsecured debt. In bankruptcy, senior unsecured debentures are always put into a class of unsecured claims with payment priority below bank loans and other secured senior debt to the extent of the value of the security behind the secured debt. By the early 1980s, the junk bond market had become the preferred financing mechanism for leveraged buyouts (LBOs) and other mergers and acquisition (M&A) activities. By 1989, junk bonds represented 20 percent of the total amount of bond debt outstanding at U.S. nonfinancial corporations.
EXHIBIT 1.2 Nonfinancial Corporations’ Credit Marker Debt to Total Marker Value of Corporate Assets, Based on Federal Reserve Data
A parallel development to the growth of the junk bond market was the development of its younger cousin, the mezzanine finance market. Companies that were too small to tap the bond market became the users of mezzanine debt. Mezzanine debt issues are much smaller and are almost always privately placed, highly illiquid, and bought with the expectation of being held to maturity. Like junk bonds, mezzanine paper is unsecured and virtually always subordinated in right of payment to bank loans and other senior debt.
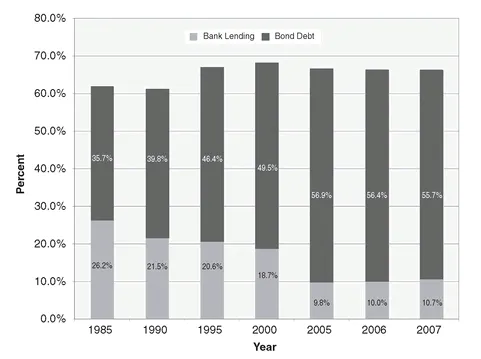
Two other phenomena occurred during the levering-up decade: the substitution of junk bond debt for bank lending, and the easing of credit underwriting standards. By the end of 1990, outstanding bank debt stood at 21.5 percent of total credit market debt, a substantial decrease from 26.2 percent at the end of 1985 (see Exhibit 1.3). This decrease was matched by an increase in total credit market debt represented by bond debt, most of which was below investment grade. By 1990, outstanding bond debt had grown to 39.8 percent of total credit market debt from a low of 35.7 percent in 1985, while total credit market debt represented by both bank lending and bond debt remained virtually unchanged in 1985 and 1990.
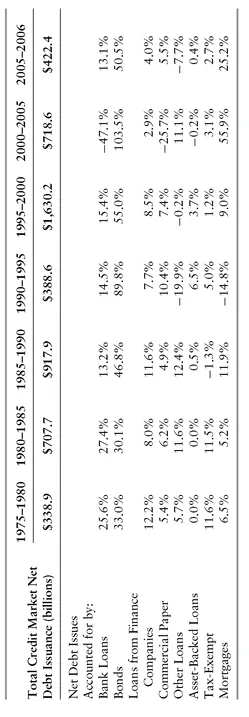
The substitution appears even more dramatic when one looks at the net issuance of credit market debt for the two five-year periods ending in 1985 and 1990 shown in Exhibit 1.4. Net new bank loans represented only 13.2 percent of total credit market debt issuance during the 1985-1990 period, compared with a 27.4 percent figure for the 1980-1985 period.
Although outstanding bank debt grew in excess of 5 percent per year, its share of the corporate capital structure declined. These statistics show an aggregate picture for the U.S. nonfinancial corporate sector. Confirming this aggregate trend, an influential study of buyouts in the 1980s showed that while bank debt represented upwards of 70 percent of all debt used in such transactions during the first half of the 1980s, it represented only 55 percent by the end of the decade.3
The reduced participation of bank lending in corporate capital structures was a result of the competitive pressures faced by banks in the past two decades. The role of commercial banks in channeling deposits to corporations was being eclipsed by lower-cost funding alternatives. On the liability side, both deregulation and the emergence of money market funds largely eliminated large banks’ ability to fund themselves at below-market rates. On the asset side, large corporate borrowers started to reach investors directly through the commercial paper market and the public market for below-investment-grade issues. As we shall discuss later in this chapter, the principal role of many commercial banks started to shift from that of a financial intermediary and investor to that of an underwriter and distributor.
EXHIBIT 1.3 Percentage of Total Corporate Debt Accounted for by Bank Lending and Corporate Bond Debt, Based on Federal Reserve Data
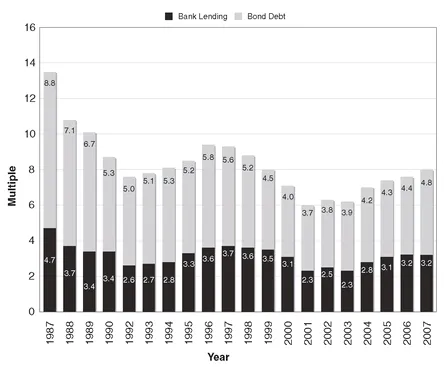
At the time when U.S. corporations were levering up their balance sheets and substituting junk bond debt for bank debt, credit underwriting standards were easing considerably in the below-investment-grade market. One sign that standards were loosened was the emergence of financial innovations designed to reduce cash interest payment burdens. One such innovation was the payment in kind (PIK) bond, or bunny bond, which reproduced itself instead of paying cash interest. Another sign of such deterioration in credit standards was the reduction in the required cash flow support per dollar of debt, which translated to much higher ratios of debt per dollar of cash flow measured by earnings before interest, taxes, depreciation, and amortization (EBITDA). In Exhibit 1.5 we show the average EBITDA debt multiples prevalent for bank and nonbank lending (mostly subordinated bond debt) for the 1987-2007 period. The very high multiples of the late 1980s are a very clear indication of the easing of underwriting standards.
EXHIBIT 1.4 Composition of U.S. Nonfinancial Corporate Credit Marker Net Debt Relative Issuance, Based on Federal Reserve Data
EXHIBIT 1.5 EBITDA Multiples for Bank Debt and Nonbank Debt, 1987-2007
It turned out that the levering-up trend of the 1980s, coupled with the substitution of high yield debt for bank lending brought about by relaxed underwriting standards, created the stage for the large supply of distressed credits of the early 1990s. Although there is controversy about all the factors that ultimately contributed to the sharp decline of liquidity in the high yield market, McCauley et al. in 1999 suggested the following as the plausible contributors:
4 • Bank regulators’ policies frowned on highly leveraged transactions at the end of 1988 and beginning of 1989.
• Passage of the Financial Institutions Reform, Recovery and Enforcement Act (FIRREA) forced savings and loans to liquidate their portfolios of junk bonds in late 1989. The Resolution Trust Corporation (RTC) rapidly disposed of junk bonds in 1990.
• Junk bond mutual funds investors redeemed about 5 percent of investments in such funds in September and October 1989.
• Campeau Corporation defaulted on an interest payment on its Federated Department Stores junk bonds in September 1989.
• RJR Nabisco’s bonds were downgraded.
• Drexel Burnham Lambert bankruptcy in early 1990 removed a major source of liquidity from the market.
The final onset of the early 1990s recession brought about a very sharp increase in the default rates for high yield debt. A much deeper recession in 1980 had brought about substantially lower de...