eBook - ePub
Market Trading Tactics
Beating the Odds Through Technical Analysis and Money Management
- English
- ePUB (mobile friendly)
- Available on iOS & Android
eBook - ePub
About this book
A veteran hockey writer takes on hockey culture and the NHL--addressing the games most controversial issue Whether its on-ice fist fights or head shots into the glass, hockey has become a nightly news spectacle--with players pummeling and bashing each other across the ice like drunken gladiators. And while the NHL may actually condone on-ice violence as a ticket draw, diehard hockey fan and expert Adam Proteau argues against hockeys transformation into a thuggish blood sport. In Fighting the Good Fight, Proteau sheds light on the many perspectives of those in and around the game, with interviews of current and former NHL stars, coaches, general managers, and league executives, as well as medical experts. One of the most well-known media figures on the hockey scene today, famous for his funny, feisty observations as a writer for the Toronto Star and The Hockey News and commentator on CBC radio and TV, Adam Proteau is also one of the few mainstream media voices who is vehemently anti-fighting in hockey. Not only is his book a plea to the games gatekeepers to finally clamp down on the runaway violence that permeates the sport even at its highest level, he offers realistic suggestions on ways to finally clean the game up. • Includes interviews with medical experts on head injuries and concussions, as well as with other members of the media • The author not only wages an attack on the value of fighting in hockey--but also on the establishment hockey culture Covering the most polarizing issue in hockey today, Fighting the Good Fight gives hockey fans and sports lovers everywhere a reason to stamp their feet and whistle--at a rare display of eloquence and common sense. WebCatUpdater-Profile_26@1326742171896
Trusted by 375,005 students
Access to over 1.5 million titles for a fair monthly price.
Study more efficiently using our study tools.
Part I
JOINING THE RUSH
Chapter 1
Trading with the Balance of Probability
To trade or not to trade is the basic question. But is profit the only answer? Many novice traders think so.
Experienced traders learn that trading is the aggressive management of risk made possible by understanding the process of finding, exploiting and managing trading opportunities, financially and mentally. Traders regularly journey into the market jungle to mine nuggets of opportunity, returning with them to trade for profit. Successful traders understand the landscape and risk, and are properly equipped. The novice, equipped with little other than enthusiasm and a dream, walks into the jungle with an eye fixed on profit. Lacking tactical survival skills, few return.
The client casualty lists from brokerages fill pages with the names of those who thought profit was the only answer, and failed. This book is for survivors. If you want to keep your name permanently off the casualty list you must equip yourself with the best prospecting equipment. Simply aiming for a profit is not enough.
To protect profits and minimize losses you make better use of your tools, use your time efficiently and listen carefully to the roar and whimper of the market crowd. Like Ulysses, who wanted to hear the call of the sirens but avoid being lured onto the rocks, we consider ways to listen to the siren call of greed without coming to grief. We look at how to identify trading opportunities, some methods to analyze only the most promising and how the supplementary numbers from the market are used to confirm the promise of profit.
Later we examine some ways to detect the sound of distant thunder as the crowd stampedes through the marketplace. The market is a master pickpocket and while profit beckons, failure has its hands in our wallets. How much it takes depends on our trading tactics.
This is a prospecting expedition into the market jungle and before taking the first steps we require some understanding of the landscape. What strange shapes await us, what unusual growths, what behaviors? How will we measure and judge them against our own experience? Do we equip for snow, sand or dense foliage? The answers decide the tools, the protective equipment and the way our expedition travels. Consider this first section as an expedition briefing for a land seen but improperly understood.
Our chosen landscape is peppered with probability and shape is delivered in bar charts. In this landscape lie the nuggets, so it pays to spend some time exploring these conditions before stepping into the market jungle. You could skip ahead and start the expedition immediately. When you decide you cannot make sense of the jungle shapes feel free to return to this expedition briefing.
Successful trading means having the balance of probability on your side. Good trading is about achieving financial objectives. Later we will look at some specific ways to identify this balance, set financial objectives and control risk by tilting the balance in our favor. Before doing this we need to renew our acquaintance with probability, and later with the way this appears on a chart.
You cannot control the market, but you can control your entry into the market and your exit from it. Successful trading places these control points near levels of greater probability.
PROBABLE ODDS
Tell people you trade the market, but don’t believe in gambling, and you have the perfect stand-up comedy routine. The laughter says a lot about general ignorance of odds and probability, and perhaps why so many ‘wanna-be’ traders become investors, holding onto losing trades. Trading against the odds, or the balance of probability, is a one-way ticket to financial ruin so understanding the concepts builds better trades.
Probability has an unfortunate historical relationship with gambling. Gambling and trading do not mix, and when we talk about the balance of probability below and throughout the book, we use the term in a very specific non-gambling sense. The concepts of probability did start with games of chance but they now play an important role in understanding risk. The concepts are applied to the construction of bridges, the planning of space flights and understanding the impact of pollutants on the environment.
Forget for a moment the gambling connection because a pair of dice is still the best way to reveal the basic concepts. Between them they have twelve faces and each number from 1 to 6 occurs once on each, or twice between the pair of them.
There are a total of 36 different outcomes. The Renaissance gambler and mathematician, Girolamo Cardano, worked out the combinations and they are shown in column C, Figure A.1 in the annex to this chapter. Experienced traders will note the dominant feature of column C immediately — the bulge in the middle. Most of us will need more time to study the table before we see there are more ways to get to some results than to others. From column A we see that throwing a 7 can be reached by six combinations, or favorable outcomes, but throwing a 12 can only be reached with a single combination.
Figure A.1 The probability bulge by the numbers: a pair of dice
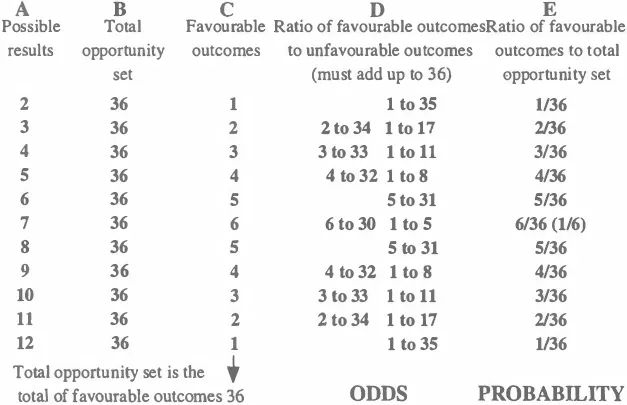
This information provides the basic calculations necessary for determining the odds and probability of any outcome. The odds of an event happening is the ratio of favorable outcomes to unfavorable outcomes. These are detailed in column D. Using 7 and 12 again, we see the odds of throwing a 7 are six throws to 30 while the odds of throwing a 12 are one throw to 35.
In contrast, the probability of an event occurring is the ratio of favorable outcomes to the total number of possible combinations, shown in column E. Staying with 7 and 12, the probability of a 7 is six throws out of 36. The probability of a 12 is one throw out of 36.
Odds or probability — the distinction is subtle. Those who are unsure of the distinction can find more detailed discussion in the annex at the end of the chapter. This naturally raises the question of trading or gambling. The distinction is important. Get it wrong and the jungle claims another victim. If you suspect you might be gambling then the tests in Chapter 20 will help.
From the trader’s perspective, what is important in the dice example is the way results tend to clump in a particular level. Whether we choose to measure the odds, or the probabilities, we still reach the same conclusion. Some outcomes are more likely than others. In market terms, reaching some profit targets is easier than others. We choose to run with probability because, as explained below, trading thrives where the total number of possible combinations is large.
This observation is at the very core of successful trading. When traders look at price action they notice immediately that prices tend to clump in particular areas. This suggests that some outcomes, some price levels, are more likely than others, or at the very least, more persistent over time than others. When we refer to the balance of probability for the remainder of the book, this is essentially what we mean.
The market is more complicated than a pair of dice. In every trade we deal with two aspects of this complexity. The first is the absolute limit in the number of possibilities for the direction of price.
In the market, in one sense, there are only four possible outcomes or events. The price will increase, decrease, remain the same or the company stops trading due to bankruptcy. They are always 1 out of 4. Or to put it another way, the odds of losing money are 3 to 4 because only one result — a rise or favorable price move — will leave us with more than our starting capital. We cannot change these outcomes, so we cannot change the odds. No trading approach puts the odds in our favor so we must look to including probability in the best solutions.
The second aspect of market complexity is the theoretically infinite combinations of possible results above zero. Prices could range from a fraction of a cent, like Australian penny stocks, to thousands of dollars for a single share in Warren Buffett’s US-based Hathaway Fund. A theoretically infinite universe of combinations is daunting, but it provides the trader with a solution because some combinations occur more frequently than others.
Whether you feel more comfortable moving with the odds, or considering the probabilities, is not as important as recognizing that building trading decisions around the tendency of some outcomes to occur more frequently than others is a winning strategy. Your primary concern is to find the best way to identify any bulge — the balance of probability — in the market similar to the bulge in Figure 1.1.
Figure 1.1 The probability bulge picture: a pair of dice
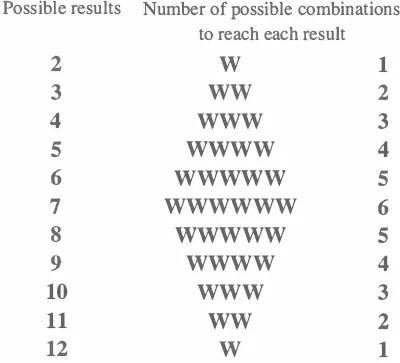
The graphic presents the same information as the figures in column C, Figure A.1, but is easier to understand. Here the balance of probability is heaviest at 7 because this result can be reached by more combinations than those required to throw a 12. Both the odds and the probabilities are weighted towards 7. Traders look for similar weightings in the market, and price clumps and trends provide the clues. Charting provides the same graphic representation of otherwise abstract figures.
The first clue is the ability of prices to move steadily in one direction for weeks or months.
Now the total number of possible combinations is not open-ended. Some combinations have extended persistence over time, either as consolidation areas where the same price re-occurs frequently, or as trends. These reference points reduce the ratio of possible combinations and favorable outcomes.
This tendency for prices to show trends attracts us to the profit opportunities and tells us where the balance of probability is weighted. If we eliminate gross market manipulation, then what creates this probability?
The probability of one direction of price action over another is not equal and is related to the way prices have behaved in the past. Price has no memory, but the buyers and sellers who decide the price do have memories, some pleasant and many bitter. Just as it takes a long time to forget the theft of money, investors cluster around price levels where they have lost money in the past. A gift of cash is more readily forgotten and levels where profit was taken in the past have less impact than levels where losses were realized.
The strength of these memories and the number of people who have similar memories help to establish the probability of price behavior. Our purpose here is to understand how to recognize this strength and how to use the probability to our advantage.
The way price behaved in the past, and in the future, is a function of fear and greed. Fear paralyses while greed galvanizes. Fear makes us hold on while prices fall, and greed encourages us to chase rising prices. Fear and greed ‘load’ the dice, and when the trader develops tools for understanding where and when the loading takes place he can make sure the balance of probability is very much in his favor.
Price action is recorded as a database of numbers and the newspaper stock report pages list the results. In elementary school, students sometimes cut up these pages and use them to make cityscapes of skyscrapers. This is as close as many people get to making a picture from printed market information — unless, like accountants and other number crunchers, they are at home with figures.
The mathematician uses numbers to calculate the odds, and the probability. Fund managers use post-modern portfolio theory to hedge against market risk. The private trader finds its difficult to calculate these intensely mathematical solutions. A page full of numbers is difficult to understand.
Mere mortals, traders included, find it easier to see the probability — the bulge — in graphic form. The price chart draws the picture and outlines the cluster of prices in the same way as Figure 1.1 shows the bulge. Deciding when the balance of probabilities is in your favor is made easier on a chart, but only if you can put aside some preconceptions and learn to read the language of the chart.
PICTURE PERFECT
The Antarctic has weird snow shapes sculpted by the wind, the desert sun-blasted rocks. Our landscape resembles that of a little known Disney educational cartoon on maths. It did little to improve arithmetic skills, but its enduring image is of a man in a landscape of distorted numbers, towering 7s and 5s, rather like a Sesame street nightmare. The market jungle replaces vegetation with elegant price bars, thickets of candlesticks and clumps of moving averages against bluffs of charting.
Charts affront many traditional market players, from company directors, to brokerages and brokers, to moms and pops. They appear to devalue their hard-won research and knowledge by suggesting prices can be understood independently from the fundamentals of the underlying company or...
Table of contents
- Cover
- Contents
- Title
- Copyright
- Preface
- Part I: Joining the Rush
- Part II: Prospecting for Trades
- Part III: Supplementary Numbers
- Part IV: Failure Waits Upon Success
- Glossary
- Index
Frequently asked questions
Yes, you can cancel anytime from the Subscription tab in your account settings on the Perlego website. Your subscription will stay active until the end of your current billing period. Learn how to cancel your subscription
No, books cannot be downloaded as external files, such as PDFs, for use outside of Perlego. However, you can download books within the Perlego app for offline reading on mobile or tablet. Learn how to download books offline
Perlego offers two plans: Essential and Complete
- Essential is ideal for learners and professionals who enjoy exploring a wide range of subjects. Access the Essential Library with 800,000+ trusted titles and best-sellers across business, personal growth, and the humanities. Includes unlimited reading time and Standard Read Aloud voice.
- Complete: Perfect for advanced learners and researchers needing full, unrestricted access. Unlock 1.5M+ books across hundreds of subjects, including academic and specialized titles. The Complete Plan also includes advanced features like Premium Read Aloud and Research Assistant.
We are an online textbook subscription service, where you can get access to an entire online library for less than the price of a single book per month. With over 1.5 million books across 990+ topics, we’ve got you covered! Learn about our mission
Look out for the read-aloud symbol on your next book to see if you can listen to it. The read-aloud tool reads text aloud for you, highlighting the text as it is being read. You can pause it, speed it up and slow it down. Learn more about Read Aloud
Yes! You can use the Perlego app on both iOS and Android devices to read anytime, anywhere — even offline. Perfect for commutes or when you’re on the go.
Please note we cannot support devices running on iOS 13 and Android 7 or earlier. Learn more about using the app
Please note we cannot support devices running on iOS 13 and Android 7 or earlier. Learn more about using the app
Yes, you can access Market Trading Tactics by Daryl Guppy in PDF and/or ePUB format, as well as other popular books in Business & Stocks. We have over 1.5 million books available in our catalogue for you to explore.