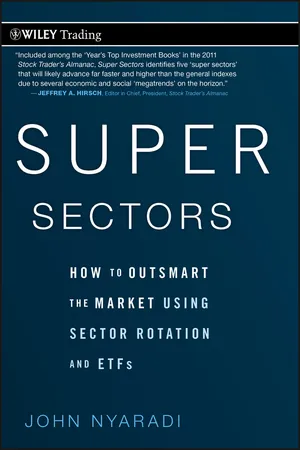
There are more than 600 exchange traded funds on the market today, and new ones are opening every day. Total worldwide invested assets in ETFs now tops $500 billion. Written in a straightforward and accessible style, Super Sectors outlines a specialized trading system that utilizes standard and leveraged exchange traded funds in an easy-to-follow plan, so that you can identify and invest in the hottest sectors in the world.
In this book, author John Nyaradi skillfully shows you how to use ETFs to take advantage of businesses and sectors that are profiting, while also minimizing risk by getting out of the same areas before they start to decline. Along the way, Nyaradi reveals how to best analyze different sectors, such as technology, utilities, industrial, energy, services, and finance, and then discusses which ETFs can help you profit from the opportunities these sectors present. The book:
• Outlines an active investment management strategy that will allow you to generate steady success in any market
• Details how different types of businesses profit and suffer during different business cycles
• Explores how sectors rotation strategies and exchange traded funds can put you in a better position to excel financially
• Includes interviews with key experts
The "buy-and-hold" strategy of yesterday won't work in today's investment environment. Nyaradi identifies the strongest potential sectors in the future. Find out what will work with Super Sectors as your guide.
- English
- ePUB (mobile friendly)
- Available on iOS & Android
eBook - ePub
About this book
Smart financial strategies that can secure your financial future
PART I
Five Wall Street Fairy Tales and Why the Conventional Wisdom is Flawed
There are many good reasons to actively manage your portfolio but one of the most compelling is to try to avoid the devastating consequences of bear markets.
Bear markets happen more frequently than you might imagine and do devastating and long-lasting damage to investors’ portfolios. But it is possible to avoid these downdrafts and later we’ll get into trading systems ranging from simple to complex that are designed to do just that.
For decades, Wall Street and the financial media have fed investors a steady diet of investment advice and concepts that have been proven to be devastatingly flawed during the Tech Wreck of 2000-2002 and again during The Great Recession of 2008.
The financial carnage has been well documented in the press with trillions in assets disappearing, maybe forever, as investors followed advice like “buy and hold,” “invest for the long term,” and “hang on, it will come back.”
And the result was no different during The Great Recession of 2008 than it was during the Tech Wreck or the Bear Market of 1982 or any bear market dating back to the Great Depression.
In every case, the average retail investor typically bought at the top and sold at the bottom and watched the stock market devour his or her hard-earned savings. As the old saying goes, “the stock market will make as big a fool out of as many people as possible,” or put another way, “the market will do everything it can to separate you from your money.”
In this section we’re going to take a look at the 5 Wall Street Fairy Tales that I feel are at the root of these problems and how they’re a real and present danger to your net worth. You’ve heard of all of these before but we’re going to delve into each one and see why it’s a hazard to your net worth.
And the danger isn’t past once The Great Recession ends because there will be other bear markets and other dangers and challenges along our paths.
So let’s start with a look at bear markets and how they’re an ever-present danger to your portfolio and financial future.
CHAPTER 1
The Bear Facts about Bear Markets
Bear markets are a frequent, normal part of the stock market life cycle, just like recessions are a normal part of the economic cycle and both of these facts create a potentially very dangerous environment for investors around the world.
THE BEAR FACTS: ANOTHER BEAR IS OUT THERE WAITING TO MAUL YOUR PORTFOLIO
Bear markets are defined as drops of 20 percent or more in the overall market typically as defined by the S&P 500, the 500 most widely held stocks in the United States.
Bear markets usually precede recessions by nine months.
Bear markets aren’t as rare as you might imagine. There have been 26 bear markets in history and they have occurred on the average of less than one every six years.
The typical decline of the major indexes in a bear market is more than −35 percent.
Put those two facts together and once every five to six years you expose yourself and your nest egg to the chance of losing −35 percent. The arithmetic regarding losses of this magnitude isn’t pretty, as outlined in Table 1.1.
TABLE 1.1 Bear Market Arithmetic
| Amount of Loss | Profit Required to Return to Breakeven |
|---|---|
| 20 percent | 25 percent |
| 30 percent | 43 percent |
| 50 percent | 100 percent |
In recent years we have seen “ultra bears”—in 1973-1974 with a decline of −48 percent, 2000-2002 declining −49 percent and 2008 declining −49 percent.
Recovery from these bear markets can be long and hard. On average, since 1929, the time to reach breakeven has been more than five years, however this time can be much, much longer. The 1929 bear market took 25 years to breakeven, the 1973-1974 bear market took more than 8 years to break even.
From 2000 to 2010, the market has still not managed to hold onto its previous highs, and investors have endured a negative rate of return for more than ten years as we went from the Tech Wreck to momentary new highs and then into The Great Recession of 2008.
In 2010, we heard a lot about the “lost decade” since the S&P 500 generated a negative rate of return between 2000 and 2010. However, it wasn’t the first secular bear market nor will it likely be the last. The most famous bear was the 1929 crash that lasted more than 20 years. Less famous is the bear that ran from 1966 to 1982, a period of 17 years, and as I write this in early 2010, we are still not back to break even from the bear that began in 2000.
Over the course of the last 80 years we have had three secular bear markets lasting a total of 48 years. Put another way, someone who began investing in 1929 has spent 60 percent of his investing career in bear markets with negative or only slightly positive returns to show for his or her efforts.
Figure 1.1 shows what a typical bear market looks like.
In the chart in Figure 1.1 it’s easy to see the devastating drop of the S&P 500 between the beginning of 2008 and the March, 2009 lows. And this type of action isn’t so unusual if we look a little farther back at the Tech Wreck of 2000-2002 as shown in Figure 1.2.
Comparing the two charts, a couple of interesting facts immediately stand out. Both bear markets started from approximately 1500 on the S&P, only nearly a decade apart from each other.
FIGURE 1.1 Bear Market of 2008 Chart courtesy of www.StockCharts.com

The 2000 Tech Wreck declined approximately −48 percent over 3.5 months while the Bear Market of 2008 declined a total of approximately −55 percent over five months.
And the subsequent rebounds look very similar when put side by side. Figure 1.3 shows what the last ten years look like altogether:
In Figure 1.3 we can see how in very real terms the stock market, as measured by the S&P 500, has generated a negative rate of return since 2000. And for many investors who tend to buy high and sell low, the returns have been much, much lower.
Of course, the picture becomes even bleaker when you factor inflation into the picture and the lost opportunity costs of nearly a decade of your investing life.
FIGURE 1.2 Tech Wreck Chart courtesy of StockCharts.com

FIGURE 1.3 Ten Year Chart of S&P 500 Chart courtesy of StockCharts.com

CONCLUSION
So after looking at the last ten years, the obvious questions must be, “Isn’t there a better way to invest than what is put forth by ‘conventional wisdom?” ’ And “what would your investment returns look like if you could consistently dodge bear market bites?”
The point here is plain and simple. For investors pursuing a buy and hold strategy, it’s a matter of when, and not if, another bear market comes along and takes a big bite out of their portfolio.
In today’s high-velocity markets, where money travels around the world at literally the speed of light, it becomes vital to have a plan to survive and prosper in a world that has changed and possibly changed forever.
Unless you believe in a stock market that can only go up and so will somehow magically take you to your investing goals, the obvious conclusion is that all in all, it would be a good idea to avoid bear markets and protect your capital so you’ll have more to grow during upswings in the market.
The purpose of this book is to outline practical methods designed to give you a chance to make that seemingly elusive goal a reality.
CHAPTER 2
The Fairy Tale of Buy and Hold
Buy and hold is possibly the most dangerous and damaging piece of advice ever given to investors around the world. How many times have you heard words like this?
“Buy and hold is the best way to go.”
“Hang on, it’ll come back.”
“What would happen if you missed the ten best days in the market?”
In the next few pages we’ll dig into the dangers and pitfalls of “buy and hold.”
TEN YEARS OF NEGATIVE RETURNS
Does ten years of negative returns sound like a really great idea? On October 19, 2009, the Dow Jones Industrial Average crossed 10,000 on its way up from the historic March lows of 6,547, and the 10,000 milestone was met with the predictable gushing and cheerleading in the financial press. But what was less heralded was the fact that the Dow had previously crossed the 10,000 barrier for the first time on March 29, 1999, more than ten years earlier.
So, in essence, buy and hold investors in the major index averages, a view often touted as a low-cost, efficient way to invest in the stock market, had just subjected themselves to ten years of no returns.
So let’s think about this for a moment. If you were a salesperson and didn’t grow your territory for ten years, do you think you’d still have a job? If you went from March 1999 to October 2009 without getting a raise or a promotion, it’s highly likely that you would be less than happy with your employer or well on your way to greener pastures.
And so it remains something of a mystery as to why we continue to hear the familiar bromides of the financial experts touting the benefits of buy and hold.
Why does this continue?
I don’t know, but the fact of the matter is that this one piece of poor advice has cost investors trillions of dollars in profits.
Between 1999 and 2010, buy and hold investors lost money. This sad statistic is further compounded by the fact that study after study show that most retail investors actually underperform even the major indexes because of their propensity to buy high and sell low.
Buyers of individual stocks have fared little better and I’m sure that if you talked to holders of MCI, Enron, U.S. Airways, General Motors, CIT, Bear Stearns, Fannie Mae, Freddie Mac and AIG, among others, they would tell you that buy and hold didn’t work out too well for them, either.
Supply and demand is a basic economic fact and rule that applies to all markets. When supply exceeds demand, prices go down. When demand exceeds supply, prices go up. This works in real estate, employment, or any commodity market. The trick...
Table of contents
- Praise
- Title Page
- Copyright Page
- Dedication
- Preface
- Acknowledgments
- PART I - Five Wall Street Fairy Tales and Why the Conventional Wisdom is Flawed
- PART II - Why Exchange Traded Funds?
- PART III - Sector Rotation: What It Is and Why It Works
- PART IV - Trading Systems Designed to Outperform the Indexes
- PART V - The Sector Scoring System: Trading Concepts, Challenges and Conundrums
- PART VI - Super Sectors: Five “Super Sectors” That Could Change Your Life
- APPENDIX - ETF Resources
- Notes
- About the Author
- Index
Trusted by 375,005 students
Access to over 1.5 million titles for a fair monthly price.
Study more efficiently using our study tools.
Frequently asked questions
Yes, you can cancel anytime from the Subscription tab in your account settings on the Perlego website. Your subscription will stay active until the end of your current billing period. Learn how to cancel your subscription
No, books cannot be downloaded as external files, such as PDFs, for use outside of Perlego. However, you can download books within the Perlego app for offline reading on mobile or tablet. Learn how to download books offline
Perlego offers two plans: Essential and Complete
- Essential is ideal for learners and professionals who enjoy exploring a wide range of subjects. Access the Essential Library with 800,000+ trusted titles and best-sellers across business, personal growth, and the humanities. Includes unlimited reading time and Standard Read Aloud voice.
- Complete: Perfect for advanced learners and researchers needing full, unrestricted access. Unlock 1.5M+ books across hundreds of subjects, including academic and specialized titles. The Complete Plan also includes advanced features like Premium Read Aloud and Research Assistant.
We are an online textbook subscription service, where you can get access to an entire online library for less than the price of a single book per month. With over 1.5 million books across 990+ topics, we’ve got you covered! Learn about our mission
Look out for the read-aloud symbol on your next book to see if you can listen to it. The read-aloud tool reads text aloud for you, highlighting the text as it is being read. You can pause it, speed it up and slow it down. Learn more about Read Aloud
Yes! You can use the Perlego app on both iOS and Android devices to read anytime, anywhere — even offline. Perfect for commutes or when you’re on the go.
Please note we cannot support devices running on iOS 13 and Android 7 or earlier. Learn more about using the app
Please note we cannot support devices running on iOS 13 and Android 7 or earlier. Learn more about using the app
Yes, you can access Super Sectors by John Nyaradi in PDF and/or ePUB format, as well as other popular books in Business & Investments & Securities. We have over 1.5 million books available in our catalogue for you to explore.