DeMark Indicators
eBook - ePub

DeMark Indicators

  1. English
  2. ePUB (mobile friendly)
  3. Available on iOS & Android
eBook - ePub

DeMark Indicators

About this book

Silver Medal Winner, Investing Category, Axiom Business Book Awards (2009)

Winner: Book Series Cover Design, The Bookbinders Guild of New York/2009 New York Book Show Awards

"Long a secret weapon for the hedge-fund elite, " says Trader Monthly, the DeMark Indicators are now used by more than 35, 000 traders.

This book provides an easy-to-follow system for using the indicators to identify market turns as they happen.

Author Jason Perl gives a concise introduction to thirty-nine of the DeMark Indicators, and then shows how to combine the indicators and time frames to achieve a higher probability of trading success.

Thomas R. DeMark, the creator of the DeMark Indicators and one of the most well-respected practitioners of technical analysis wrote the Foreword to this book.

This is the second book in the Bloomberg Market Essentials: Technical Analysis series, which covers the key elements of the most widely used technical analysis tools.

Frequently asked questions

Yes, you can cancel anytime from the Subscription tab in your account settings on the Perlego website. Your subscription will stay active until the end of your current billing period. Learn how to cancel your subscription.
At the moment all of our mobile-responsive ePub books are available to download via the app. Most of our PDFs are also available to download and we're working on making the final remaining ones downloadable now. Learn more here.
Perlego offers two plans: Essential and Complete
  • Essential is ideal for learners and professionals who enjoy exploring a wide range of subjects. Access the Essential Library with 800,000+ trusted titles and best-sellers across business, personal growth, and the humanities. Includes unlimited reading time and Standard Read Aloud voice.
  • Complete: Perfect for advanced learners and researchers needing full, unrestricted access. Unlock 1.4M+ books across hundreds of subjects, including academic and specialized titles. The Complete Plan also includes advanced features like Premium Read Aloud and Research Assistant.
Both plans are available with monthly, semester, or annual billing cycles.
We are an online textbook subscription service, where you can get access to an entire online library for less than the price of a single book per month. With over 1 million books across 1000+ topics, we’ve got you covered! Learn more here.
Look out for the read-aloud symbol on your next book to see if you can listen to it. The read-aloud tool reads text aloud for you, highlighting the text as it is being read. You can pause it, speed it up and slow it down. Learn more here.
Yes! You can use the Perlego app on both iOS or Android devices to read anytime, anywhere — even offline. Perfect for commutes or when you’re on the go.
Please note we cannot support devices running on iOS 13 and Android 7 or earlier. Learn more about using the app.
Yes, you can access DeMark Indicators by Jason Perl in PDF and/or ePUB format, as well as other popular books in Business & Finance. We have over one million books available in our catalogue for you to explore.

Information

Year
2010
Print ISBN
9781576603147
eBook ISBN
9780470885352
Edition
1
Subtopic
Finance

Chapter 1

TD Sequential

Defining the Trend and Identifying Exhaustion Points

When I started looking at the DeMark indicators in the early 1990s, it was TD Sequential that first piqued my interest. I had previously come across other technical studies that identified trading opportunities well when prices were trending, and still other indicators that were particularly suited to ranges, but I had found it frustrating that none of these approaches was sufficiently dynamic to distinguish between these two very different types of price action.
TD Sequential appeals to me because it addresses that problem, having both momentum (TD Setup) and trending (TD Countdown) components. Furthermore, it’s completely objective and incorporates disciplined money-management rules, and (because it’s based on relative price action) you can apply it to any market or time frame, regardless of the market’s underlying volatility, without having to change any of the default indicator settings.
For those of us brought up in the computer age, it may seem hard to believe, but Tom DeMark developed TD Sequential by hand, through a process of trial and error, in the 1970s. It never ceases to amaze me how something originally created to analyze daily price data can be applied so effectively, more than thirty years later, to any time frame—from one minute to one year—and to any market.
Since the majority of people are trend followers, it’s hardly surprising that “the trend is your friend” is one of the most widely quoted trading mantras. While it may seem counterintuitive, given that most people do follow trends, TD Sequential attempts to isolate prospective exhaustion points in ranges, to anticipate market tops and bottoms when it believes prices are overbought or oversold and during trends when sentiment is invariably at an extreme. Even if you are not inclined to the technical, TD Sequential can be helpful for market-timing purposes, as an adjunct to your existing arsenal of trading tools. Traders oriented to fundamentals tell me it helps them determine take-profit levels when they would otherwise be reliant on a less-efficient price-reversal pattern to close out a profitable position. TD Sequential also highlights, at the time the signal is generated, points where one should refrain from establishing or adding to an existing position in the direction of the underlying trend. Once you’re comfortable with the methodology, however, you can use TD Sequential as I do, to fade trends.
Let’s look at the components of TD Sequential in order to understand how and why it manages to be so versatile. The indicator has two components: TD Setup, which relies on momentum to define price ranges, and TD Countdown, which is trend based, and looks for low-risk opportunities to fade established directional moves. As TD Sequential is probably the most-talked-about TD indicator, I’ll explain it in detail for both bullish and bearish scenarios, as well as answer some frequently asked questions.

TD Setup

TD Setup is one component of TD Sequential; the other component, TD Countdown, cannot come into play until a TD Setup formation is complete. TD Setup, however, is not only a prerequisite for the broader-trend-reversal TD Countdown signal; it is also an indicator, one that can help determine whether a market is likely to be confined to a trading range or starting a directional trend. TD Setup, of course, has both buy and sell indicators, and I will address them separately.
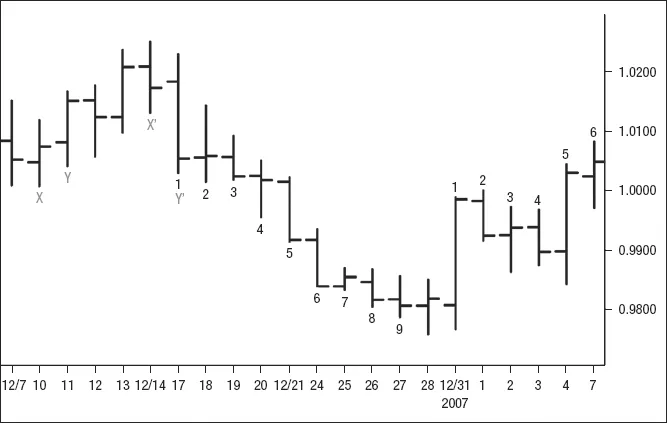
The prerequisite for a TD Buy Setup is a Bearish TD Price Flip, which indicates a switch from positive to negative momentum (Figure 1.1).
FIGURE 1.1 Bearish TD Price Flip to Initiate a TD Buy Setup
The chart of USDCAD illustrates the price action necessary to produce a bearish TD Price Flip for the initiation of a TD Buy Setup, that is, a close greater than the close four price bars earlier, immediately followed by a close less than the close four bars earlier. In this instance, the close of X’ is above the close of X, and X’ is followed by Y’, which is below Y. The chart also shows the extension of that price action into an uninterrupted series of nine consecutive closes, each one less than the corresponding close four price bars earlier.
Note: The bar on which the bearish TD Price Flip occurs qualifies as bar one of the prospective TD Buy Setup.
image
- - - - - - - - - -
Bearish TD Price Flip
A Bearish TD Price Flip occurs when the market records a close greater than the close four bars earlier, immediately followed by a close less than the close four bars earlier.
- - - - - - - - - -
- - - - - - - - - -
TD Buy Setup
After a bearish TD Price Flip, there must be nine consecutive closes, each one less than the corresponding close four bars earlier.
- - - - - - - - - -
Since the indicator was originally designed to look at daily price data, a comparison of the closing price with the closing price four bars earlier represents a rolling week.

Interruption of a TD Buy Setup

If, at any point, the sequence—of nine consecutive closing prices less than the closing price four bars earlier (up to and including the close of TD Buy Setup bar nine)—is interrupted, the developing TD Buy Setup will be canceled and must begin anew.
Having to start all over again can test one’s patience, because it postpones the appearance of a signal. But the delay is meaningful, because it suggests a change in market dynamics, which the indicator acknowledges by changing its behavior.

Completion of the First Phase of TD Sequential

Once a TD Buy Setup successfully reaches nine, the first phase of TD Sequential is complete, and a TD Buy Countdown can begin.

TD Sell Setup

For a prospective sell situation, before a TD Sell Countdown can begin, we need to see a bullish TD Price Flip—a switch from negative to positive momentum (Figure 1.2)—in order to initiate a TD Sell Setup.
FIGURE 1.2 Bullish TD Price Flip to Initiate a TD Sell Setup
The chart of AUDJPY illustrates the price action necessary to produce a bullish TD Price Flip for the initiation of a TD Sell Setup, that is, a close less than the close four price bars earlier, immediately followed by a close greater than the close four bars earlier. In this instance, the close of X’ is below the close of X, and X’ is followed by Y’, which is above Y. The chart also shows the extension of that price action into an uninterrupted series of nine consecutive closes,...

Table of contents

  1. Cover
  2. Contents
  3. Title
  4. Copyright
  5. Foreword
  6. Acknowledgments
  7. Introduction
  8. Author’s Note
  9. About DeMark Indicator Trademarks
  10. Chapter 1: TD Sequential
  11. Chapter 2: TD Combo
  12. Chapter 3: TD D-Wave
  13. Chapter 4: TD Lines
  14. Chapter 5: TD Retracements
  15. Chapter 6: TD Trend Factor and TD Propulsion
  16. Chapter 7: TD Oscillators
  17. Chapter 8: TD Moving Averages
  18. Chapter 9: TD Range Projection, TD Range Expansion Breakout, and TD Channels
  19. Chapter 10: Short-Term Indicators
  20. Chapter 11: TD Waldo Patterns
  21. Chapter 12: Putting It All Together
  22. Chapter 13: Learning the DeMark Indicators
  23. Index