Written by Wayne McDonell, the Chief Currency Coach at FX Bootcamp, this book shows readers how to successfully trade the Forex market on their own. FX Bootcamp's Guide to Strategic and Tactical Forex Trading skillfully explains how to combine popular technical indicators to formulate a comprehensive market strategy. Readers will then learn how to focus on using this information to create a tactical trading plan--one that will help them pull the trigger to get in and out of a trade. Along the way, McDonell takes the time to discuss the various challenges a Forex trader faces, such as greed, fear, loss, and isolation. As a Forex trader and educator of traders, Wayne McDonell knows what it takes to make it in the competitive world of Forex. And with FX Bootcamp's Guide to Strategic and Tactical Forex Trading he shows readers how.
- English
- ePUB (mobile friendly)
- Available on iOS & Android
eBook - ePub
The FX Bootcamp Guide to Strategic and Tactical Forex Trading
About this book
A straightforward guide to trading today's dynamic Forex market
Trusted by 375,005 students
Access to over 1.5 million titles for a fair monthly price.
Study more efficiently using our study tools.
PART ONE
Basic Training
The goal for Part One is to develop a common language that you and I can use. The rest of the book will discuss how the technical indicators highlighted in the first two chapters work together to tell a story of what is happening in the foreign exchange (forex) market.
Currency charts use candles and technical indicators to communicate. It is important for you to have a strong understanding of these building block indicators that form the foundation of the trading methodologies discussed in this book.
To learn this language as you read this book, I highly recommend that you take the time to set up your charting package with these indicators and settings so you can practice the methodology. Members of FX Bootcamp have access to a template that makes this easy. Nonmembers will just have to invest a little more time, but it will be worth the effort. Read the book, study the concepts, practice on your demo account, and develop long-term positive trading skills.
In Part One you will learn:
• The difference between a simple moving average (SMA) and an exponential moving average (EMA).
• How to trade moving average crossovers.
• How to use the moving average convergence divergence (MACD) indicator.
• How to trade MACD divergence.
• How to use Bollinger Bands.
• How to trade volatility.
• How to spot a technical reversal.
• How to identify support and resistance (S&R).
• How to trade a break or bounce of S&R.
• How to trade S&R role reversals.
• How to use Fibonacci retracements.
• How to use Fibonacci extensions.
• How to use pivot points.
CHAPTER 1
Lagging Indicators
Most technical indicators are lagging, which means they are slow. They tell you what just happened ... after the fact. However, by combining historic price action with predictive price patterns, we’ll have enough evidence to form the basis of a trade plan.
In this chapter, you will learn how to use technical analysis to read your charts. It is critically important to learn these concepts well. They are key to understanding the market’s behavior. The technical indicators we’ll discuss do not control the market, but they describe a story of how traders are trading it.
MOVING AVERAGES
A moving average (MA) is an average of a predetermined number of prices (such as closing price) calculated over a number of periods (such as 55 candles). The higher the number of candles in the average, the smoother the line is.
A moving average makes it easier to visualize price action without statistical noise. Instead of watching the up and down behavior of every candle, you are watching the relatively smooth moving average line. Moving averages are a common tool in technical analysis and they are used within all time frames: 1-minute, 5-minute, 15-minute, 30-minute, 60-minute, 120-minute, 240-minute, daily, weekly and monthly candle charts, for example.
It is important to observe that a moving average is a lagging rather than a leading indicator. Its signals occur after the new price movements, not before. Moving averages do not think ahead. They tell you what has happened, not what will happen. Nonetheless, moving averages have a critical role to play in properly planning your trades in advance. The past does not always predict the future, but it sure likes to repeat itself.
SMAs vs EMAs
There are two types of commonly used moving averages:
1. SMA: The simple moving average or arithmetic mean.
This moving average is only an average. Add up all the candles that you’d like to measure and then divide by the number of candles you added together. For example, a 21 SMA is calculated by adding the closing price of the last 21 candles and then dividing by 21. Simple, eh?
2. EMA: The exponential moving average.
The exponentially smoothed moving average takes into account more than just the previous price information of the underlying currency. It places more weight on the most recent previous candles. This makes it more sensitive to the most recent price action. For example, a 21 EMA places more weight on the last 5 candles than the first 5 candles.
The exponential moving average reacts to price changes more quickly than the simple moving average does because it pays more attention to newer candles.
I like moving averages a lot. You will see later in this book that at FX Bootcamp we use several different moving averages at once, but they offer different pieces of the puzzle when planning our trades. When the market is steadily rolling along, moving averages keep us in our trades, but if something changes, such as a moving average crossover, we’ll likely get out or trade the new direction.
Moving Average Crossovers
Moving averages are frequently used as price filters. To filter choppy price action into a more reliable indication for true price action, a short-term moving average has to cross a longer-term moving average.
The trade planning methodology we teach in the FX Bootcamp training sessions is to use several moving averages on the chart simultaneously. The most obvious use for multiple moving averages is to watch for crossovers to confirm new trends.
A crossover would consists of a short-term (21 candles) EMA that crosses a longer term EMA (55 candles). Short-term EMAs (fast) are more sensitive to price changes because they are measuring fewer candles. Conversely, longer term EMAs (slow) tend to be more flat and are less likely to whipsaw up and down.
When moving averages do cross, you should take notice. If the fast EMA crosses below the slow EMA, it likely confirms new downward price action. If the fast EMA crosses above the slow EMA, it likely confirms new upward price action. However, such crosses should not prompt you to place a trade, as it often occurs too late and will put you in the market an unfavorable risk/reward ratio. The crossover should have been part of the trade plan that you created in advance, as not every crossover is the same. Moving average crossovers are great because they are easy to see and will attract traders, but they simply do not replace the work of planning your trades.
A simple use of moving averages is using them to gauge the speed and direction of the trend. If prices are held by the 21 EMA, the trend could be considered strong. If prices break the 21 EMA, you should become more cautious. This could be the sign of a reversal or a consolidating market. New rules will apply. We’ll discuss this in more detail later in the book, as it is a key concept to trade planning.
MOVING AVERAGE CONVERGENCE DIVERGENCE (MACD)
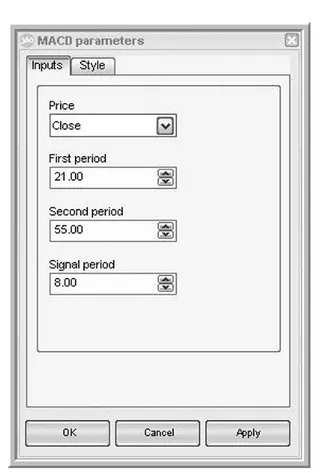
Moving average convergence divergence, generally known as MACD (pronounced “mack dee”) is one of the most reliable and simple indicators in our toolbox. MACD is a trend-following momentum indicator, or oscillator, which shows the relationship between two moving averages of recent prices. An example is shown in Figure 1.1.
The MACD is often made up of three components:
1. MACD Line: The actual MACD line is calculated by subtracting a slow moving average (EMA) from a fast EMA. In our example we use the 21 as the fast EMA and the 55 as the slow EMA.
2. Signal Line: The signal line represents an EMA, not of price, but of the MACD. In this case we calculate the EMA of our MACD for the last eight bars.
3. Histogram: The MACD histogram is the difference between the MACD and its signal line.
MACD just might be the most popular indicator used by forex traders. That is why we recommend that you use it. However, be aware that MACD is often misused. Like any other technical indicator, you cannot rely on it for trades. It should be part of your entire trading planning process.
FIGURE 1.1 Moving Average Convergence Divergence (MACD)
Source: DealBook® 360 screen capture printed by permission. c 2008 by Global Forex Trading, Ada MI USA
How to Use MACD
There are three common scenarios to watch for:
1. Crossovers: When the MACD falls below the signal line it is a bearish signal, and indicates that it may be time to sell. Conversely, when the MACD rises above the signal line, the indicator gives a bullish signal, and suggests that it may be time to buy.
2. Divergence: When the price diverges from the MACD, it signals the end of the current trend. When the price is rising and MACD is falling (negative divergence), or vice versa, it can be considered an indication of something going on and can be used to predict changes in a trend. That’s right, the lagging indicator that is supposed to follow the price is predicting future behavior.
3. Dramatic Expansion: When the MACD expands dramatically—that is, the shorter moving average pulls away from the longer term moving average—it is a signal that the currency is overbought/oversold and may soon return to normal levels.
Once again, let me be perfectly clear. All three of these scenarios are important and should not be overlooked. However, none of them are signals to trade. They are opportunities to form trade plans based on likely outcomes commonly generated by such situations.
For example, MACD divergence is tradable only when confirmed by other indicators. It does not always yield profitable trade opportunities. Therefore, if you traded every MACD divergence, just like if you traded every moving average crossover, you would certainly lose money.
However, when planned in advance and confirmed with other technical indicators, success is much more likely. This is because several things are happening at once and each is attracting the same bulls or bears in...
Table of contents
- Title Page
- Copyright Page
- Preface
- Introduction
- PART ONE - Basic Training
- PART TWO - Strategic Analysis
- PART THREE - Rules of Engagement
- PART FOUR - Tactical Planning
- PART FIVE - Psychological Warfare
- BOOK BUYBACK PROGRAM
- Index
Frequently asked questions
Yes, you can cancel anytime from the Subscription tab in your account settings on the Perlego website. Your subscription will stay active until the end of your current billing period. Learn how to cancel your subscription
No, books cannot be downloaded as external files, such as PDFs, for use outside of Perlego. However, you can download books within the Perlego app for offline reading on mobile or tablet. Learn how to download books offline
Perlego offers two plans: Essential and Complete
- Essential is ideal for learners and professionals who enjoy exploring a wide range of subjects. Access the Essential Library with 800,000+ trusted titles and best-sellers across business, personal growth, and the humanities. Includes unlimited reading time and Standard Read Aloud voice.
- Complete: Perfect for advanced learners and researchers needing full, unrestricted access. Unlock 1.5M+ books across hundreds of subjects, including academic and specialized titles. The Complete Plan also includes advanced features like Premium Read Aloud and Research Assistant.
We are an online textbook subscription service, where you can get access to an entire online library for less than the price of a single book per month. With over 1.5 million books across 990+ topics, we’ve got you covered! Learn about our mission
Look out for the read-aloud symbol on your next book to see if you can listen to it. The read-aloud tool reads text aloud for you, highlighting the text as it is being read. You can pause it, speed it up and slow it down. Learn more about Read Aloud
Yes! You can use the Perlego app on both iOS and Android devices to read anytime, anywhere — even offline. Perfect for commutes or when you’re on the go.
Please note we cannot support devices running on iOS 13 and Android 7 or earlier. Learn more about using the app
Please note we cannot support devices running on iOS 13 and Android 7 or earlier. Learn more about using the app
Yes, you can access The FX Bootcamp Guide to Strategic and Tactical Forex Trading by Wayne McDonell in PDF and/or ePUB format, as well as other popular books in Business & Foreign Exchange. We have over 1.5 million books available in our catalogue for you to explore.