![]()
Chapter 1
Building Blocks: Selected Excel Functions and Tools
This chapter provides examples of the use of a selection of Excel functions. It is not possible within the scope of this text to provide complete coverage of all Excel functions; rather the focus is on those that are generally important in financial modelling at the intermediate and advanced level. Readers may naturally refer to other texts on Excel or to the Help menu within Excel (F1 short-cut) to learn more about the full range of functions.
CORE FUNCTIONS FOR FINANCIAL MODELLING
This section summarises the basic functions required for many financial modelling applications. While many of these are essentially self-explanatory and are likely to be well known to many readers, certain aspects of their use and features are worth highlighting.
Arithmetic Operations
The basic functions for arithmetical operations (classified in Excel within either the Math & Trig or Statistical categories) include:
- AVERAGE calculates the average of a set of numbers.
- COUNT counts the number of cells that contain numbers (COUNTA counts the number of non-empty cells, and so includes the counting of text fields).
- MIN and MAX calculate the minimum and maximum of a set of values.
- PRODUCT multiplies its arguments.
- SUBTOTAL calculates the sum (or other values) of a range of cells, ignoring other SUBTOTAL functions, so avoiding potential double-counting of values.
- SUM adds up a set of numbers.
- SUMPRODUCT multiplies the corresponding elements of two ranges and forms their sum.
Example: PRODUCT
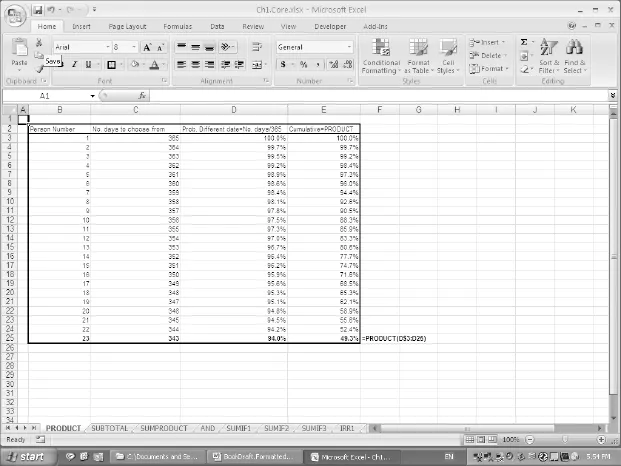
Where the values in a contiguous range of cells are to be multiplied, the PRODUCT function provides a smaller formula with easier updating than the alternative approach (in which individual cell references are multiplied).
The file Ch1.Core.xlsx (PRODUCT worksheet) (Figure 1.1) shows an example in which a range of cells containing probabilities is multiplied. It shows that there is a probability of just less than 50% that a group of 23 people have birthdays on different days to each other. That is, in a group of 23 people, it is more likely than not that at least two people share a birthday.
Example: SUBTOTAL
The SUBTOTAL function ignores other SUBTOTAL functions, and so avoids double-counting when applied to a range that contains this function (unlike the SUM function, which would lead either to double-counting or to a large set of cumbersome, inflexible and error-prone formulae).
The function has an argument that allows different calculations to be performed on the data set. For example, the sum of the range requires the use of the argument 9, whereas the average and count require the value of 1 and 2 respectively (see the Help menu for the full description). Frequent uses of the function include:
- The creation of subtotals in a large list of data that is sorted into categories.
- In financial statement modelling, where a company’s total assets may be calculated from the (subtotal) of its fixed and current assets, which may themselves each be calculated as the subtotal of a more detailed breakdown (such as equipment, working capital, etc.).
- The analysis of sets of filtered data (see later), where the function ignores any hidden rows that result from a list having been filtered (unlike SUM, COUNT).
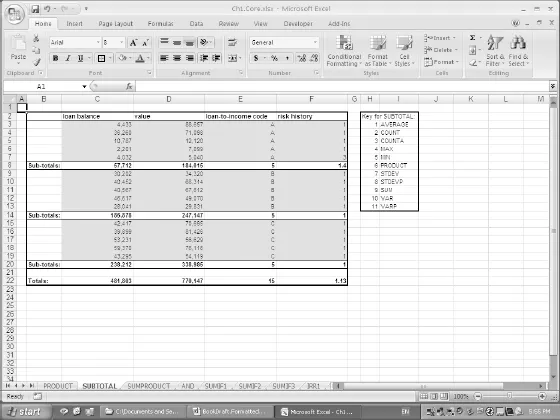
The SUBTOTAL function can be entered either by direct insertion into a cell (by explicit typing or insertion from the Math & Trig category), or by use of Data/Subtotal (Data/ Subtotals in Excel 2003) when applied to a list or table of data. In the latter case the data will usually have first been ordered or sorted in some way (perhaps through use of the Data/Sort menu), so that the inserted subtotals are at the relevant break-points in the list. This latter route will result in grouped data appearing.
The file Ch1.Core.xlsx (SUBTOTAL worksheet) (Figure 1.2) shows an example where the function was entered by direct insertion (the arguments for the different types are also shown for convenience).
Example: SUMPRODUCT
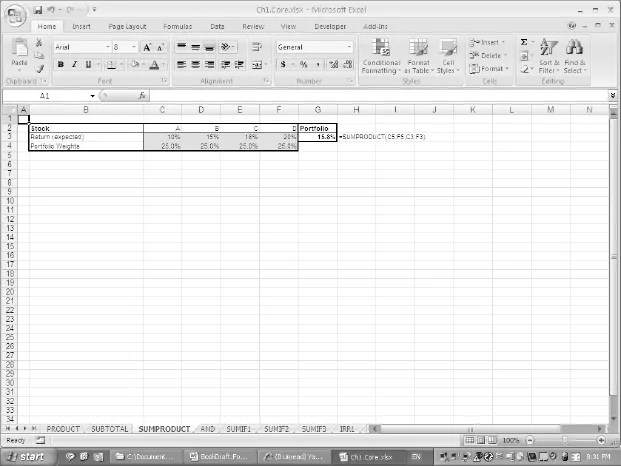
The file Ch1.Core.xlsx (SUMPRODUCT worksheet) (Figure 1.3) shows an example of the SUMPRODUCT function in a simple portfolio analysis situation. It is used in order to calculate the weighted average (i.e. expected) return of a portfolio that consists of assets with given weights and expected returns.
Logical Operations
The basic logical functions include:
- AND checks if two conditions both hold, and returns TRUE or FALSE accordingly. Similarly OR and NOT functions exist. These can be useful to avoid writing embedded IF statements when checking multiple conditions.
- IF checks whether a condition is true or not and returns a specified value in each case. Its use is implicit in a direct comparison expression such as = F7>F6, which would evaluate to either TRUE or FALSE (these are not text strings, but when used in any subsequent formulae, are interpreted by Excel as 1 or 0 respectively). Therefore = 50*(F7>F6) would return either 50 or 0. Similarly, while one may write = IF(F7>F6,1,0), this would not be the same as = IF(F7>F6,“TRUE”,“FALSE”), which returns text strings (and is therefore generally inconvenient when the results of such expressions are to be used in further numerical calculations).
Related functions include:
- SUMIF (classified in the Math & Trig category) adds the values of cells in a given range according to whether a criterion is met in another range. Excel 2007 also has a SUMIFS function in which a range is summed according to multiple criteria being met; an example is shown later in this chapter. In addition, in some cases the use of Database functions, PivotTables, or the Conditional Sum Wizard can provide more appropriate alternatives (see later).
- COUNTIF (classified in the Statistical category) counts the number of cells that meet a specified criterion. In Excel 2007, the AVERAGEIF function exists, as do AVERAGEIFS and COUNTIFS when multiple criteria are to be met.
Example: AND
The file Ch1.Core.xlsx (AND worksheet) (Figure 1.4) shows the hypothesised development of the gross domestic product (GDP) of the US and Chinese economies (indexed so that the starting value of the US is 100), and demonstrates the use of AND to check whether two...