- English
- ePUB (mobile friendly)
- Available on iOS & Android
eBook - ePub
Encyclopedia of Candlestick Charts
About this book
Following in the footsteps of author Thomas Bulkowski's bestselling Encyclopedia of Chart Patterns—and structured in the same way—this easy-to-read and -use resource takes an in-depth look at 103 candlestick formations, from identification guidelines and statistical analysis of their behavior to detailed trading tactics. Encyclopedia of Candlestick Charts also includes chapters that contain important discoveries and statistical summaries, as well as a glossary of relevant terms and a visual index to make candlestick identification easy.
Trusted by 375,005 students
Access to over 1.5 million titles for a fair monthly price.
Study more efficiently using our study tools.
Chapter 1
Findings
Arguably, you are reading the most important chapter because it discusses the discoveries I made about candles while researching this book. You may already know some of them, but the others are new. I’ll refer to many of them in later chapters.
A Number of Candles Do Not Work as Expected
This is the big surprise for candle lovers. A candle that functions as a reversal of an upward trend should cause price to drop. Thus, a close above the top of the preceding candle would be a failure because price climbed instead of fell, whereas a close below the previous low would be a success. Similarly, a continuation candle should have price break out in the same direction as it entered. If price rose into the candle, for example, it should break out upward; a downward breakout would be a failure. How many of the 103 candles I looked at passed or failed according to this method?
Passed: 69%
Failed: 31%
If you listen closely, you may hear the half-glass-full people screaming. Yes, 69% of the candles worked, so let’s discuss additional tests. If I say that a success rate of less than 60% is considered just random, then how many candles worked at least 60% of the time? There are 412 different combinations of 103 candles that acted as reversals or continuations in bull and bear markets. Of the 412, only 100 candles qualified, so the answer is 24%.
If I filter the group by using a frequency rank of 51 or better, then just 10% qualify. The 51 rank is about midway in the list of 103 candles. As a reference, the candle with rank 51 appeared 1,973 times out of 1,204,083 candle lines in 500 stocks over 10 years, including bull and bear markets. In other words, just 10% of candles work at least 60% of the time and occur frequently enough to be found.
If I raise the bar to a 66% success rate (meaning the candle should work as expected in two of three trades) and keep the frequency rank the same, then only 6% qualify. That means just 6% of the candles I consider to be investment grade.
Please remember that this applies only to stocks and not futures, exchange-traded funds, or other security types, so the results could change dramatically.
The following lists the investment grade candles:
Above the stomach
Belt hold, bearish and bullish
Deliberation
Doji star, bearish
Engulfing, bearish
Last engulfing bottom and top
Three outside up and down
Two black gapping candles
Rising and falling windows
These are the candle patterns in which price reverses or continues in the anticipated direction frequently, but it does not indicate how far price trends after that. For a more detailed description of performance over time, see Chapter 2, Statistics Summary.
An Unusually Tall Candle Often Has a Minor High or Minor Low Occurring within One Day of It
I looked at tens of thousands of candles to prove this, and the study details are on my web site, ThePatternSite.com.
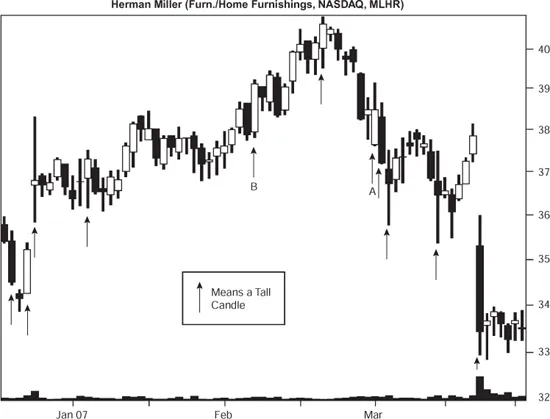
Figure 1.1 shows examples of unusually tall candles highlighted by up arrows. A minor high or low occurs within a day of each of them (before or after) except for A and B. Out of 11 signals in this figure, the method got 9 of them right, a success rate of 82% (which is unusually good).
Figure 1.1 The up arrows highlight candles taller than average. A minor high or minor low occurs within plus or minus one day of most of the tall candles.
Follow these steps to use the results.
1. The tall candle must be above the highs of two and three days ago (for uptrends) or below the lows of two and three days ago (for downtrends).
2. Find the average high-low height of the prior 22 trading days (a calendar month), not including the current candle.
3. Multiply the average height by 146%. If the current candle height is above the result, then you have an unusually tall candle.
Expect a peak within a day from unusually tall candles 67% of the time during an uptrend and a valley within a day 72% of the time in a downtrend. Additional peaks or valleys can occur after that, so the minor high or low need not be wide or lasting. However, if you have a desire to buy a stock after a tall candle, consider waiting. The chances are that price will reverse and you should be able to buy at a better price.
The Best Performance Comes from Candles with Breakouts within a Third of the Yearly Low
This is true regardless of bull or bear markets, up or down breakouts. The percentages of chart patterns with breakouts within a third of the designated range that showed the best performance are:
Highest third: 5%
Middle third: 11%
Lowest third: 84%
I discovered another trend during chart pattern research that is similar. Here is where breakouts from the best-performing chart patterns with upward breakouts reside in the yearly price range:
Highest third: 27%
Middle third: 32%
Lowest third: 41%
For downward breakouts from chart patterns, the performance list is:
Highest third: 20%
Middle third: 25%
Lowest third: 55%
The results confirm that you should not short stocks making new highs but, rather, concentrate on those making new lows.
Gaps Don’t Work Well as Support or Resistance Zones
Read the chapters on windows (both rising and falling) if you don’t believe me. I looked for minor highs or minor lows in a price gap and found that most often price just shoots through the gap without stopping. Here are the results:
Gaps in an uptrend (rising window): Price finds overhead resistance within the gap only 20% of the time in a bull market and 16% of the time in a bear market.
Gaps in a downtrend (falling window): Price finds underlying support within the gap only 25% of the time in a bull market and 33% of the time in a bear market.
Reversals Occur Most Often Near Price Extremes
I split the yearly price range into thirds and then mapped those patterns with reversals onto the yearly price range (based on the breakout price). I found that those within a third of the yearly high acted as reversals most often, followed closely by those within a third of the yearly low. Here are the results:
Highest third: 45%
Middle third: 12%
Lowest third: 43%
I would like to say that if you see a candle that usually acts as a reversal in the middle of the yearly price range you should ignore it—chances are price will not reverse, and if it does it probably won’t be a lasting move. However, I’m not sure that’s correct.
For continuations, here is where they appear most often, based on the location of the breakout price:
Highest third: 42%
Middle third: 10%
Lowest third: 48%
For reference, this is where all candle types (whether signaling a reversal, a continuation, or indecision) appear within the yearly price range. Some candles are neither a reversal nor a continuation, like a high wave, spinning top, or doji.
Highest third: 63%
Middle third: 9%
Lowest third: 28%
Opening Gap Confirmation Gives the Best Entry Signal
I tested three confirmation methods: closing price, candle color, and opening gap. See Glossary and Methodology, Table 6, for definitions of the three methods. Here is how often each confirmation method worked:
Closing price confirmation: 5%
Candle color confirmation: 13%
Opening gap confirmation: 82%
Candles with Breakouts below the 50-Day Moving Average Give the Best Performance
I tore apart my computer software at least three times checking to see if I had made a mistake on this one. I found that when the breakout from a candle is below the 50-trading-day moving average, performance is better than if the breakout is above the moving average. Here is how often each resulted in better performance:
Above the moving average: 14%
Below the moving average...
Table of contents
- Cover
- Contents
- Title
- Copyright
- Dedication
- Preface
- Acknowledgments
- Introduction
- Chapter 1: Findings
- Chapter 2: Statistics Summary
- Chapter 3: 8 New Price Lines
- Chapter 4: 10 New Price Lines
- Chapter 5: 12 New Price Lines
- Chapter 6: 13 New Price Lines
- Chapter 7: Abandoned Baby, Bearish
- Chapter 8: Abandoned Baby, Bullish
- Chapter 9: Above the Stomach
- Chapter 10: Advance Block
- Chapter 11: Below the Stomach
- Chapter 12: Belt Hold, Bearish
- Chapter 13: Belt Hold, Bullish
- Chapter 14: Breakaway, Bearish
- Chapter 15: Breakaway, Bullish
- Chapter 16: Candle, Black
- Chapter 17: Candle, Short Black
- Chapter 18: Candle, Short White
- Chapter 19: Candle, White
- Chapter 20: Concealing Baby Swallow
- Chapter 21: Dark Cloud Cover
- Chapter 22: Deliberation
- Chapter 23: Doji, Dragonfly
- Chapter 24: Doji, Gapping Down
- Chapter 25: Doji, Gapping Up
- Chapter 26: Doji, Gravestone
- Chapter 27: Doji, Long-Legged
- Chapter 28: Doji, Northern
- Chapter 29: Doji, Southern
- Chapter 30: Doji Star, Bearish
- Chapter 31: Doji Star, Bullish
- Chapter 32: Doji Star, Collapsing
- Chapter 33: Downside Gap Three Methods
- Chapter 34: Downside Tasuki Gap
- Chapter 35: Engulfing, Bearish
- Chapter 36: Engulfing, Bullish
- Chapter 37: Evening Doji Star
- Chapter 38: Evening Star
- Chapter 39: Falling Three Methods
- Chapter 40: Hammer
- Chapter 41: Hammer, Inverted
- Chapter 42: Hanging Man
- Chapter 43: Harami, Bearish
- Chapter 44: Harami, Bullish
- Chapter 45: Harami Cross, Bearish
- Chapter 46: Harami Cross, Bullish
- Chapter 47: High Wave
- Chapter 48: Homing Pigeon
- Chapter 49: Identical Three Crows
- Chapter 50: In Neck
- Chapter 51: Kicking, Bearish
- Chapter 52: Kicking, Bullish
- Chapter 53: Ladder Bottom
- Chapter 54: Last Engulfing Bottom
- Chapter 55: Last Engulfing Top
- Chapter 56: Long Black Day
- Chapter 57: Long White Day
- Chapter 58: Marubozu, Black
- Chapter 59: Marubozu, Closing Black
- Chapter 60: Marubozu, Closing White
- Chapter 61: Marubozu, Opening Black
- Chapter 62: Marubozu, Opening White
- Chapter 63: Marubozu, White
- Chapter 64: Mat Hold
- Chapter 65: Matching Low
- Chapter 66: Meeting Lines, Bearish
- Chapter 67: Meeting Lines, Bullish
- Chapter 68: Morning Doji Star
- Chapter 69: Morning Star
- Chapter 70: On Neck
- Chapter 71: Piercing Pattern
- Chapter 72: Rickshaw Man
- Chapter 73: Rising Three Methods
- Chapter 74: Separating Lines, Bearish
- Chapter 75: Separating Lines, Bullish
- Chapter 76: Shooting Star, One-Candle
- Chapter 77: Shooting Star, Two-Candle
- Chapter 78: Side-by-Side White Lines, Bearish
- Chapter 79: Side-by-Side White Lines, Bullish
- Chapter 80: Spinning Top, Black
- Chapter 81: Spinning Top, White
- Chapter 82: Stick Sandwich
- Chapter 83: Takuri Line
- Chapter 84: Three Black Crows
- Chapter 85: Three Inside Down
- Chapter 86: Three Inside Up
- Chapter 87: Three-Line Strike, Bearish
- Chapter 88: Three-Line Strike, Bullish
- Chapter 89: Three Outside Down
- Chapter 90: Three Outside Up
- Chapter 91: Three Stars in the South
- Chapter 92: Three White Soldiers
- Chapter 93: Thrusting
- Chapter 94: Tri-Star, Bearish
- Chapter 95: Tri-Star, Bullish
- Chapter 96: Tweezers Bottom
- Chapter 97: Tweezers Top
- Chapter 98: Two Black Gapping Candles
- Chapter 99: Two Crows
- Chapter 100: Unique Three-River Bottom
- Chapter 101: Upside Gap Three Methods
- Chapter 102: Upside Gap Two Crows
- Chapter 103: Upside Tasuki Gap
- Chapter 104: Window, Falling
- Chapter 105: Window, Rising
- Bibliography
- Glossary and Methodology
- Visual Index
- Subject Index
Frequently asked questions
Yes, you can cancel anytime from the Subscription tab in your account settings on the Perlego website. Your subscription will stay active until the end of your current billing period. Learn how to cancel your subscription
No, books cannot be downloaded as external files, such as PDFs, for use outside of Perlego. However, you can download books within the Perlego app for offline reading on mobile or tablet. Learn how to download books offline
Perlego offers two plans: Essential and Complete
- Essential is ideal for learners and professionals who enjoy exploring a wide range of subjects. Access the Essential Library with 800,000+ trusted titles and best-sellers across business, personal growth, and the humanities. Includes unlimited reading time and Standard Read Aloud voice.
- Complete: Perfect for advanced learners and researchers needing full, unrestricted access. Unlock 1.5M+ books across hundreds of subjects, including academic and specialized titles. The Complete Plan also includes advanced features like Premium Read Aloud and Research Assistant.
We are an online textbook subscription service, where you can get access to an entire online library for less than the price of a single book per month. With over 1.5 million books across 990+ topics, we’ve got you covered! Learn about our mission
Look out for the read-aloud symbol on your next book to see if you can listen to it. The read-aloud tool reads text aloud for you, highlighting the text as it is being read. You can pause it, speed it up and slow it down. Learn more about Read Aloud
Yes! You can use the Perlego app on both iOS and Android devices to read anytime, anywhere — even offline. Perfect for commutes or when you’re on the go.
Please note we cannot support devices running on iOS 13 and Android 7 or earlier. Learn more about using the app
Please note we cannot support devices running on iOS 13 and Android 7 or earlier. Learn more about using the app
Yes, you can access Encyclopedia of Candlestick Charts by Thomas N. Bulkowski in PDF and/or ePUB format, as well as other popular books in Business & Finance. We have over 1.5 million books available in our catalogue for you to explore.