![]()
Chapter 1
Introduction
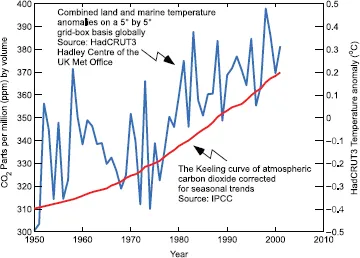
The Earth’s climate is now clearly changing and getting warmer. Many components of the climate system are changing at rates and in patterns that are not natural and are best explained by the increased atmospheric abundances of greenhouse gases and aerosols generated by human activity during the 20th century. These changes include temperatures of the atmosphere, land and ocean; the extent of sea ice and mountain glaciers; the sea level; the distribution of precipitation; and the length of the seasons (AGU, 2008).
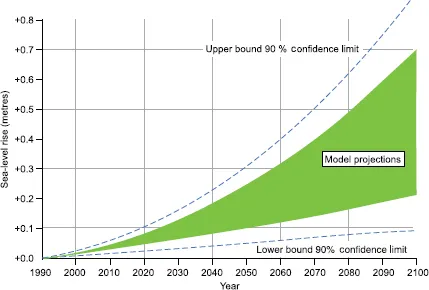
The Intergovernmental Panel on Climate Change (IPPC), made up of hundreds of scientists from 113 countries, reached a consensus in 2007 that, based on new research concluded in the last decade, it is 90 per cent certain that human-generated greenhouse gases account for most of the global rise in temperatures. The IPPC was very specific, predicting that, even under the most conservative scenario, the global increase of temperature will be between 1.1 C and 6.4 C by 2100, and the sea level will rise between 18 cm and 58 cm during that same time period (Collins et al., 2007; IPCC, WMO/UNEP, 2007).
The Earth has warmed consistently and unusually over the past few decades in a manner that can be explained only when a greenhouse process is overlaid on orbital variation, solar variation, volcanic eruptions and other natural disturbances. Observational evidence, complex modelling and simple physics all confirm this. Whatever the proportion of human-induced rise in global temperature versus natural rise, there is no doubt that the temperature and the sea level are rising, the Greenland and Antarctic ice sheets are disintegrating, and major weather patterns and ocean currents are shifting (Figs. 1.1 and 1.2.). The Earth’s warming is already causing severe droughts and flooding, major vegetation transformations in deserts and forests, massive tundra methane releases and the degradation of the Amazon rainforest and Saharan vegetation (Gates, 1993). It is also starting to impact the Indian Ocean Monsoon, the Atlantic Conveyor Belt and El Niño weather patterns. The economic impacts of droughts in the USA alone cause $68 billion in losses per year (Chagnon, 2000).
Decision-makers and scientists need reliable science-based information to make informed judgements regarding policy and actions in order to be able to address the risks of such changes and variability in climate and related systems. To have any hope of mitigating or adapting to these mostly undesirable changes, we must be able to monitor them continuously and over large global regions. Ship and field observations have provided important data on these phenomena in the past and will do so in the future. However, to be able to observe environmental changes globally, it is necessary to use remote sensors on satellites and aircraft in order to extend local measurements to large areas.
For example, without satellite remote sensing we could not have mapped accurately the changes in the Antarctic ozone hole or the disintegration of ice sheets in Greenland and other areas. In fact, it was the ability to view these global changes with remote sensors from satellite altitudes that brought the enormity and severity of these environmental changes to the attention of scientists, politicians and the general public. Many such important datasets are now available in near-real time at no cost, through web portals such as Google Earth and Google Ocean, allowing ‘citizen’ scientists to accomplish research objectives and promoting public engagement with science in general.
Remote sensing is now a mature enough technology to answer some of the fundamental questions in global environmental change science, namely:
1. How and at what pace is the Earth system changing and what are the forces causing these changes?
2. How does the Earth system respond to natural and human-induced changes?
3. How well can we predict future perturbations to the Earth system and what are the consequences of change to human civilization?
Ice sheets, ocean currents and temperatures, deserts and tropical forests each have somewhat different remote sensing requirements. For instance, ocean temperatures are measured by thermal infrared sensors, while ocean currents, winds, waves, and sea level require various types of radar instruments on satellites. Most ocean features are large and require spatial resolutions of kilometres, while observations of desert or forest changes may require resolutions of tens of metres and many bands within the visible and near-infrared region of the electromagnetic spectrum. Monitoring of coral reefs demands even finer spatial resolution and multiple bands pooled in the short-wavelength visible spectrum.
Fortunately, by the turn of this century, most of these requirements had been met by NASA (the National Aeronautics & Space Administration) and NOAA (the National Oceanic & Atmospheric Administration) satellites and aircraft, the European Space Agency (ESA) and the private sector (Jensen, 2007). Furthermore, new satellites are being launched, carrying imagers with fine spatial (0.64 m) and spectral (200 narrow bands) resolutions, as well as other environmental sensors. These provide a capability to detect changes in both the local and the global environment even more accurately. For the first time, constellations of satellites are being launched with the sole aim of quantifying aspects of the Earth’s climate synergistically. With such technology available, governments are no longer alone in being able to monitor the extent of tropical forests and coral reefs, the spread of disease and the destruction caused by war.
Advances in the application of Geographical Information Systems (GIS) and the Global Positioning System (GPS) help to incorporate geo-coded ancillary data layers in order to improve the accuracy of satellite image analysis. When these techniques for generating, organizing, sorting and analyzing spatial information are combined with mathematical climate and ecological models, scientists and managers can improve their ability to assess and predict the impact of global environmental changes and trends (Lunetta & Elvidge, 1998).
To handle the vast quantities of information being generated by today’s Earth observation programmes, there have been significant advances made in the use of the Internet to store and disseminate geospatial data to scientists and the public. The Internet is set to play an even greater role in the handling of products delivered by future missions.
This book is intended to provide the reader with a broad grounding in the science of Earth observation of our changing planet. It contains a comprehensive sequenced discussion that covers the significant themes of global change, their cause, and how they can be monitored through time. In doing so, it represents a good source of basic information and a general overview of the status of remote sensing technology.
The text will serve as an invaluable reference for managers and researchers, regardless of their specialty, while also appealing to students of all ages. The scope of the work yields a reference book that presents the science of remote sensing through a series of pertinent real-world environmental case studies. It offers excellent background material for a course curriculum, being tuned in terms of its length, and the material covered, to fit a variety of teaching scenarios. Each chapter presents an important environmental phenomenon that:
i is relevant to global change or the status of the biosphere; and
ii lends itself to remote monitoring.
Each case study offers insights into new remote sensing techniques. The work presents the fundamentals of the technology underpinning each sensor type and delivers sufficient detail for the reader to grasp the mode of operation of the instrument and how it can be used to detect and measure the environmental parameters at hand. Thus, the book is aimed at a broad audience concerned with the application of remote sensing in Earth science, biological science, physical geography, oceanography and environmental science programmes. It is designed for a reader who does not require an in-depth knowledge of the technology of remote sensing, but who needs to understand how it is used as a key tool for mapping and monitoring global change.
1.1 Key concepts
1. The Earth’s climate is getting warmer and the patterns of the weather and ocean currents are changing. Severe droughts and flooding are becoming more prevalent and the ice sheets of Greenland and at the poles are disintegrating.
2. The global sea level is rising by about 2 to 3 mm per year, threatening to inundate many coastal areas by the end of this century.
3. Remote sensors on satellites offer an effective way for monitoring environmental trends on a global scale. They can detect physical and biological changes in the atmosphere, in the oceans and on land. Satellite systems have become the defining technology in our ability to quantify global change.
4. The accuracy and applicability of satellite imagery is constantly improving due to technological advances, such as finer spectral/spatial resolution, more powerful computers, the Global Positioning System (GPS) and Geographical Information Systems (GIS).
5. When these techniques for generating, organizing and analyzing spatial information are combined with mathematical and environmental models, scientists and managers have a means for assessing and predicting the impact of global environmental changes.
![]()
Chapter 2
Remote sensing basics
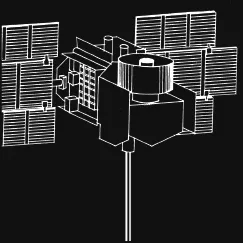
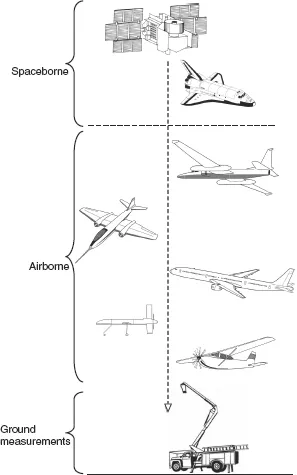
Remote sensing is primarily concerned with collecting and interpreting information about an object or landscape from a remote vantage point. The platform can be anywhere, ranging from a balloon just above the surface of the Earth to a satellite hundreds of kilometres away in space (Figure 2.1). Examples of remote sensing include aerial photography, satellite imagery, radar altimetry and laser bathymetry. Coupled with ground measurements, remote sensing can provide valuable information about the surface of the land, the oceans and the atmosphere.
Techniques for acquiring aerial photographs were already developed in the 1860s; however, colour and colour-infrared (CIR) aerial photographs were not widely used until the 1940s and 1950s. The 1950s and 1960s marked the appearance of remote sensing applications for airborne radar and video technologies.
A significant event in terms of land remote sensing was the 1972 launch of the first Landsat satellite, originally called ERTS-1. The satellite was designed to provide frequent broad-scale observations of the Earth’s land surface. Since 1972, additional Landsat satellites have been put into orbit. Other countries, including France, Japan, Israel, India, Iran, Russia, Brazil, China, and perhaps North Korea, have also launched satellites whose onboard sensors provide digital imagery on a continuous basis.
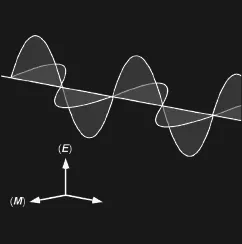
2.1 Electromagnetic waves
Electromagnetic (EM) energy refers to all energy that moves with the velocity of light in a harmonic wave pattern. A harmonic pattern consists of waves that occur at equal intervals in time. EM waves can be described in terms of their velocity, wavelength and frequency. All EM waves travel at the same velocity (c). This velocity is commonly referred to as the speed of light, since light is ...