![]()
Chapter One
Pointing the Way with Technical Indicators
IN THIS CHAPTER
Examining support and resistance
The power of moving averages
Discovering Average True Range and Inertia
Combining indicators for effective trading
I’m a strong believer that your success with options is contingent on the use of technical indicators, which is why I chose to start the book here. This chapter will outline some of the many technical indicators that you can use within the market. We will go through the basics such as support and resistance levels, moving averages, Stochastics, and MACD. We will also head further into advanced technical indicators such as Bollinger Bands, Fibonacci retracements, Ease of Movement, Inertia, and Average True Range (ATR). The more indicators you have within your tool box, the better prepared you’ll be for any market condition or type of trade. Mastering these technical skills will be necessary for you to become a successful options trader.
Support and Resistance Levels
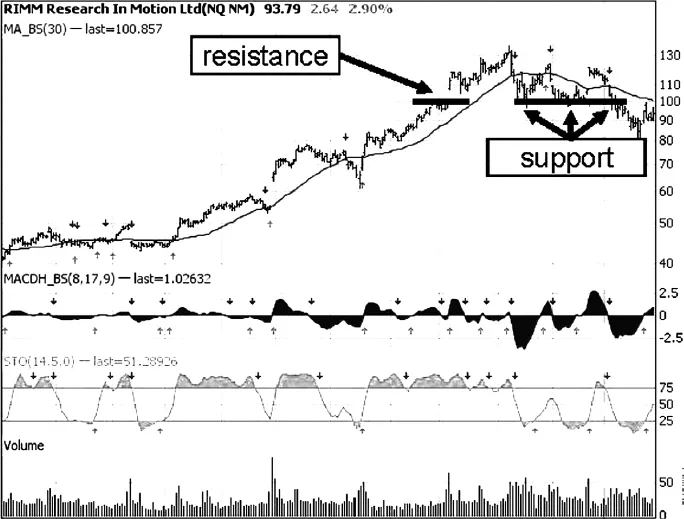
There are price points when stocks will often make a change in direction and move from an upward direction (resistance) to a downward direction (support) and vice versa from support to resistance. Keep in mind that an old resistance level will become the new support level when the movement is breaking upward and old support will become new resistance in a downward trend. Let’s look at a few charts that highlight these levels of support and resistance.
Figure 1.1 shows both the support and resistance levels, beginning with resistance on the left side. Our chart shows that when the stock was moving higher, it reached a level of resistance, which you’ll notice was established at the price of $100. Once the stock broke up through this resistance level of $100 (which is often on increased volume), the stock continued higher until reaching a high of $130, which again became resistance. After the stock reached $130, the price dropped back to the $100 level (old resistance now new support) where it finally on the third attempt failed to stay above $100 (support) and dropped to about $80 per share.
Moving Averages
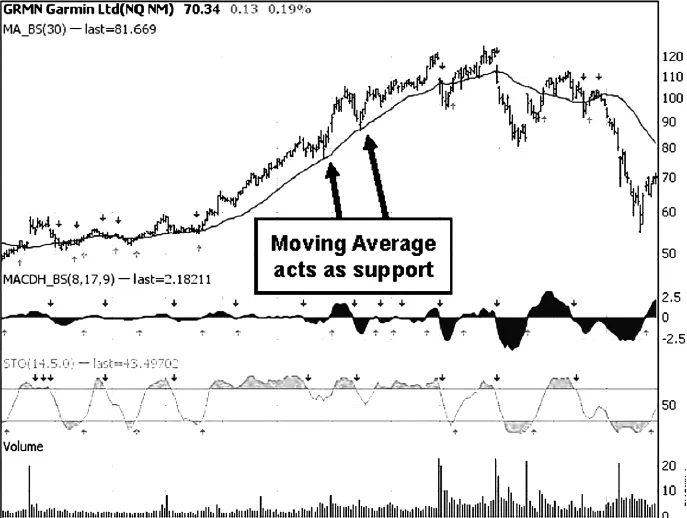
Moving averages are price indications as to what the average price of the stock is over a certain given time frame. For example, let’s begin with a 30-day simple moving average; it represents the average price of the stock for the last 30 days. As a trader, moving averages are helpful in many ways, but we use them primarily to determine our entry or exit points.
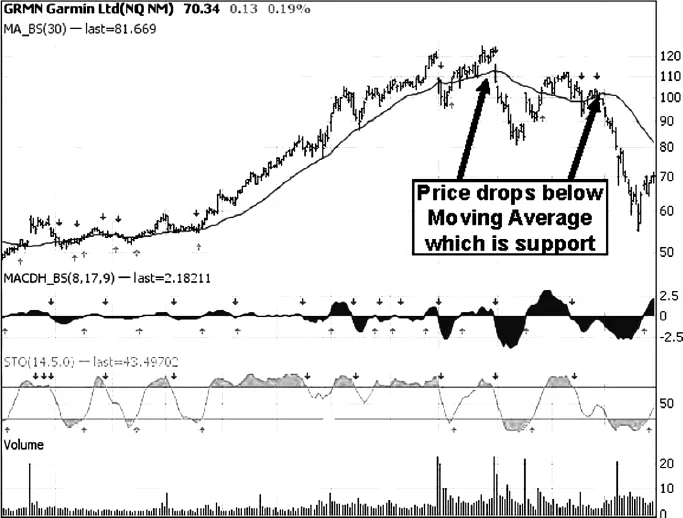
During an uptrend (Figure 1.2), the 30-day moving average acts as a support level and as long as the stock price remains above this level, the stock should continue back up. If you look at Figure 1.3, you’ll notice that when stock price does not stay above the 30-day moving average, it drops further down and even faster than when it went up. When the stock does begin its next upward movement, it will more than likely have a tough time getting above the 30-day moving average because what was support will often become resistance. With this example we were using a 30-day moving average as short-term support and resistance levels. In the next example, you’ll see how we can use multiple moving averages like the 30-, 50-, 100-, and 200-day moving averages.
Multiple Moving Averages
Using several moving averages helps us determine what the next point of support or resistance will be. It’s said that when a stock drops below its 30-day support level, it will move towards its 50-day moving average, which will be another level of support. When breaking that level, it will test its 100-day and then finally its 200-day moving average. When the stock drops below it’s 200-day moving average, which is referred as the strongest point of support (on downward moving stocks), the stock has broken its long-term support and now its downward trend will increase even more. This 200-day moving average acts the opposite when stocks are moving off of their lows and heading up because the 200-day is now resistance. If the stock can increase above this level, it is considered a very bullish sign and the stock now has great upside potential. I’m going to begin showing you several different charts with four moving averages.
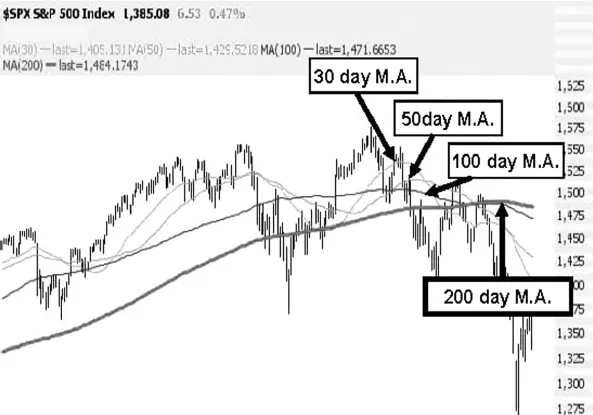
As you can see in Figure 1.4 for the S&P 500 we have four different settings, 30-, 50-, 100-, and the 200-day moving average. When I trade, I use various colors to set up my moving averages so I know which ones are which (on this chart they are labeled for you). For example the 30-day moving average is the short-term support level if the stock is above it and is short-term resistance if the stock is below. The 50- and 100-day moving averages are the next points of support when trending down. The all-important 200-day moving average is the long-term support level for any stock or index. Keep in mind that these are levels of resistance as stocks or indexes move upwards.
If you take a quick snapshot of the S&P 500 chart (Figure 1.4), you’ll see that when the price of the index is above all four moving averages, then the index has a tendency to be bullish and move upward; yet, when the price of the index begins dropping below the 30-day moving average, we see our first signs of weakness (you should begin to determine your exit or place stop losses now). At this point, the index will tend to move to the next level of support, which will be the 50-day. If it can stop at that level, it will move higher, making the 30-day the resistance level; however, when it drops below the 50-day, it’s going to move towards the 100-day and look for support. If it cannot stop (which it did not in this example), the index will drop towards the 200-day and if this fails, then you know you’ll have the greatest odds of a bearish downward move.
Insider Secret
Think of each moving average as a different testing level of support (on downward moving stocks) or resistance (on upward moving stocks). The stock or index will keep pushing in its given direction until one of these levels of moving averages stops it. If none of them hold, then you can be sure that the movement of the stock will be strong in its original direction.
As a general rule, when long the market, you want prices to stay above these moving averages and when short, you want prices to stay below them.
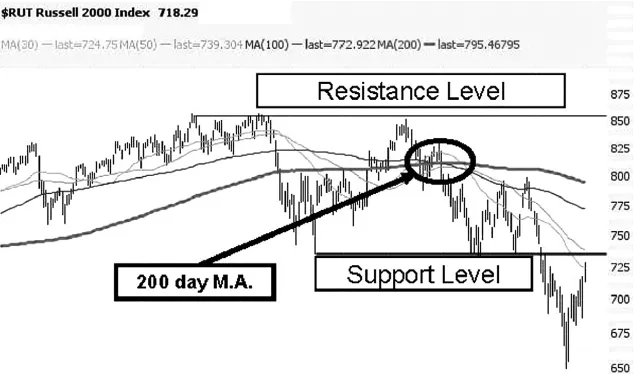
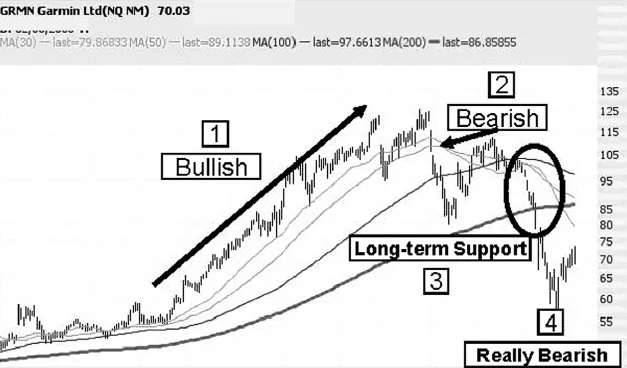
I know it sounds confusing, so let’s look at a second and third example. We’ll review the Russell 2000 index (Figure 1.5) and GRMN (Figure 1.6) to simplify the importance of the multiple moving averages.
Looking at the example of the Russell 2000 index (Figure 1.5), you’ll notice several points of interest. First, I always like to determine the long-term one year support and resistance levels, which are not just based on the use of moving averages but also on the highs and lows of the 12-month chart (as we talked about earlier).
We determined the resistance (ceiling) was the 850 point because the index could not move above this area after making several attempts to do so. The support level (floor) was between 725 and 750, so we’ll call it 735. Now that we know what to expect during...