An in-depth look at current issues, new research findings, andinterdisciplinary exchange in survey methodology andprocessing
Survey Measurement and Process Quality extends the marriage oftraditional survey issues and continuous quality improvementfurther than any other contemporary volume. It documents thecurrent state of the field, reports new research findings, andpromotes interdisciplinary exchange in questionnaire design, datacollection, data processing, quality assessment, and effects oferrors on estimation and analysis.
The book's five sections discuss a broad range of issues and topicsin each of five major areas, including * Questionnaire design--conceptualization, design of rating scalesfor effective measurement, self-administered questionnaires, andmore * Data collection--new technology, interviewer effects, interviewmode, children as respondents * Post-survey processing and operations--modeling of classificationoperations, coding based on such systems, editing, integratingprocesses * Quality assessment and control--total quality management,developing current best methods, service quality, quality effortsacross organizations * Effects of misclassification on estimation, analysis, andinterpretation--misclassification and other measurement errors, newvariance estimators that account for measurement error, estimatorsof nonsampling error components in interview surveys
Survey Measurement and Process Quality is an indispensable resourcefor survey practitioners and managers as well as an excellentsupplemental text for undergraduate and graduate courses andspecial seminars.
Trusted by 375,005 students
Access to over 1.5 million titles for a fair monthly price.
Error Effects on Estimation, Analyses, and Interpretation
Chapter 27
A Review of Measurement Error Effects on the Analysis of Survey Data
Paul P. Biemer
Research Triangle Institute, Research Triangle Park
Dennis Trewin
Australian Bureau of Statistics
27.1 INTRODUCTION
This section reviews the effects of measurement error on a number of standard univariate and multivariate analysis techniques. Much has appeared in the literature about the existence of measurement error in survey data, methods for reducing measurement error through better survey design, methods for compensating for the error effects at the analysis stage, and standards for informing users of the risks in ignoring measurement errors in the interpretation of the final results. The present chapter addresses the motivation for all this attention to measurement error.
Why are we concerned about measurement error? For example, it is well known that when independent random errors are added to survey data, the variance increases but the expected value of the mean or total remains unbiased so long as the random errors have zero expectation. Although these types of errors may increase standard errors, the standard errors can be reduced by increasing the sample sizes. Other than their potential to increase costs, why should we be concerned with these errors? This chapter responds to that question and shows that even independent errors having zero mean can create that analysts may use. In fact, the population mean or total and its standard error are the only two commonly used statistics that are not biased by these errors. The chapter also examines the effects of errors that are clustered within interviewer or other operator assignments on data analytical methods.
In Section 27.2, we consider models for the analysis of continuous survey data as well as models which are more appropriate for categorical data analysis. In addition, for each of these model forms we consider the effects of measurement errors when the errors are uncorrelated between the units in the sample as well as when correlations between the units are introduced by an interviewer, coder, supervisor, or other survey operator. This section of the chapter sets the stage for the review of the error effects that follows.
Section 27.3 considers the effect of correlated and uncorrelated error on univariate analysis; in particular, descriptive statistics such as means, proportions, totals, and population quantiles. Section 27.4 deals with the effects of error on multivariate data analysis, including: regression analysis, correlation analysis, analysis of variance, analysis of covariance, and categorical data analysis (specifically, goodness-of-fit tests and tests of independence between two variables). In all these discussions, our goal is to provide insight into the nature of the error effects and a basic understanding of the potential risks involved in ignoring the errors in data analysis. We do not attempt to provide a complete review of the models that have been proposed for studying measurement error’s effect on data analysis. Nor do we attempt to provide thorough coverage of the methods for compensating for their effects. To do so would lengthen the chapter unacceptably. However, in Section 27.5 we provide a summary of the most commonly used error compensation methods and references to articles in this and other volumes that deal with these issues.
27.2 MODELS FOR STUDYING THE MEASUREMENT ERROR EFFECTS
Survey error models are essential for understanding the effects of measurement errors on statistics and methods of statistical inference. Error models allow us to concisely and precisely communicate the nature of the errors that are being considered, the survey conditions that give rise to them, the ways in which errors affect the expected values of the estimates, variances and variance estimators, and the magnitudes of these effects. To facilitate our discussion, we will employ two general models for measurement error: one for continuous data and one for binary data. In addition, to facilitate the exposition of the main results, we assume simple random sampling (SRS) without replacement where the sampling fraction, n/N, is negligible.
27.2.1 Error Model for Continuous Data
In this chapter, the most general form of the continuous error model that is considered assumes that an observation, yj, on a randomly selected unit j is the sum of two components: the true value, μj, for the unit and an error, dj, which may be attributed to the measurement process, including the interviewer, the questionnaire, the respondent, the mode of interview, the interview setting, and so on.
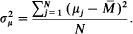
Let U = {1, 2,…, N} denote the label set for the target population consisting of N units. Then the expected value and variance of the true value, μj, associated with the jth unit are given, respectively, by
(27.1)
and
(27.2)
In its most general form, the structure of the error, dj, provides for potential correlations among the measurement errors due to interviewers, supervisors, coders, or other survey operators. Let S = {1, 2,…, n} denote the sample of n = Im units ...
Table of contents
Cover
Half Title page
Title page
Copyright page
Contributors
Preface
Introduction
Section A: Questionnaire Design
Section B: Data Collection
Section C: Post-Survey Processing and Operations
Section D: Quality Assessment and Control
Section E: Error Effects on Estimation, Analyses, and Interpretation
Index
Frequently asked questions
Yes, you can cancel anytime from the Subscription tab in your account settings on the Perlego website. Your subscription will stay active until the end of your current billing period. Learn how to cancel your subscription
No, books cannot be downloaded as external files, such as PDFs, for use outside of Perlego. However, you can download books within the Perlego app for offline reading on mobile or tablet. Learn how to download books offline
Perlego offers two plans: Essential and Complete
Essential is ideal for learners and professionals who enjoy exploring a wide range of subjects. Access the Essential Library with 800,000+ trusted titles and best-sellers across business, personal growth, and the humanities. Includes unlimited reading time and Standard Read Aloud voice.
Complete: Perfect for advanced learners and researchers needing full, unrestricted access. Unlock 1.5M+ books across hundreds of subjects, including academic and specialized titles. The Complete Plan also includes advanced features like Premium Read Aloud and Research Assistant.
Both plans are available with monthly, semester, or annual billing cycles.
We are an online textbook subscription service, where you can get access to an entire online library for less than the price of a single book per month. With over 1.5 million books across 990+ topics, we’ve got you covered! Learn about our mission
Look out for the read-aloud symbol on your next book to see if you can listen to it. The read-aloud tool reads text aloud for you, highlighting the text as it is being read. You can pause it, speed it up and slow it down. Learn more about Read Aloud
Yes! You can use the Perlego app on both iOS and Android devices to read anytime, anywhere — even offline. Perfect for commutes or when you’re on the go. Please note we cannot support devices running on iOS 13 and Android 7 or earlier. Learn more about using the app
Yes, you can access Survey Measurement and Process Quality by Lars E. Lyberg, Paul P. Biemer, Martin Collins, Edith D. de Leeuw, Cathryn Dippo, Norbert Schwarz, Dennis Trewin, Lars E. Lyberg,Paul P. Biemer,Martin Collins,Edith de Leeuw,Cathryn Dippo,Norbert Schwarz,Dennis Trewin,Edith D. de Leeuw, Lars E. Lyberg, Paul P. Biemer, Martin Collins, Edith de Leeuw, Cathryn Dippo, Norbert Schwarz, Dennis Trewin in PDF and/or ePUB format, as well as other popular books in Mathematics & Probability & Statistics. We have over 1.5 million books available in our catalogue for you to explore.