![]()
PART ONE
ACHIEVING GROWTH DURING CHALLENGING TIMES
We Learn That America’s Highest-Growth
Companies Grow through All Economic
Cycles and Share a Common
Success Pattern
![]()
Chapter 1
Companies That Are Redefining Growth
Consider these startling facts. Despite America being a global leader for innovation and growth, more than 60 percent of America’s new public companies since 1980 no longer exist. In contrast, 4 percent have achieved more than $1 billion in revenue. Joining this elite set of 4 percent are an average of 34 public companies per year achieving $1 billion in revenue, independent of up or down economic cycles. The remaining companies are caught in a struggle between the greater odds of failure and the significant upside benefits for achieving exceptional growth.
On a side note, for those companies with more than $1 billion in revenue aspiring to grow to $10 billion, the ratio of failure to success is the same: Only 4 percent make it to $10 billion from $1 billion in revenue!
These ratios and the success rate of America’s highest-growth companies have been true for the past decade and are forecasted to be true for the second decade of this century. The companies that are redefining growth are the ones that are growing through the most challenging of times, not just during up economic cycles when the rising tide lifts all boats.
At the close of the first decade of the twenty-first century, business is entering unchartered territory. Recent trends suggest that we are moving out of a recession (fairly labeled “the Great Recession”) into a unique growth phase characterized by ongoing recession-like characteristics with high unemployment with growth.The heady growth cycles of the late 1990s and the go-go years of 2004 to 2007 will likely not return. The numbers in this book point to an extreme financial scenario for business growth: a higher upside for those businesses that achieve growth with a greater failure rate for those that struggle: “Grow or Go.” Management teams are clearly identifying the risk of not growing and are searching, with a renewed sense of urgency, to identify the effective actions that will grow their businesses.
Independent of economic conditions, what is the success pattern of America’s highest-growth companies that enables them to achieve consistent growth through all economic cycles? What are their growth insights that you can apply?
This book does more than uncover these companies’ growth insights; it also provides effective lessons from chief executives who are leading their companies to grow even through the most challenging of times. Applying these insights will improve your odds of success to achieve high growth independent of the size of your company or the state of our economic cycle.
Those of us in business naturally view business growth through different lenses, often based on our business experiences. Inventors view growth opportunities through their lens of innovation opportunities. On the other hand, financial services experts view growth through changes in financial performance and company valuations.
In contrast, I define a growth company as having a simple, fundamental, and essential characteristic: achieving compounding customer demand as measured by revenue growth. This allows companies to grow revenue every year, which is the number-one objective of just about all for-profit management teams—and the one that is most difficult to achieve. This is the measure, however, that ultimately defines a growth company. This same measure is constant through all economic cycles.
Revenue growth gives the management team the option of generating profit and returns for investors and employees. It is not sustainable to do the reverse—that is, to overinvest, or to cut costs to generate profit and then look for revenue growth—yet all too many management teams travel this dead-end road to short-term success.
Even though today’s economic challenges may seem like an unfavorable headwind, companies of all sizes can achieve consistent and compounding revenue growth: $1 million, $10 million, $50 million, $200 million, $500 million, and even $1 billion and beyond. Growth rates may slow temporarily as a result of declining or rapidly changing market conditions, but revenues of high-growth companies still average compounding revenue-growth rates over the longer term, annually across multiple years.1
America’s exceptional growth companies have a consistent track record of growing through recessionary periods and becoming the leaders for the next economic growth cycle. While the list of names changes, what is in common is that companies achieve growth during the toughest of times. During the 1993 recession, Cisco, Cadence Design, and Cracker Barrel Restaurants, which averaged revenues of $500 million, continued to achieve revenue growth. Since this recessionary period, Cadence Design and Cracker Barrel are $1 billion-plus companies with Cisco growing to a stellar $36 billion in revenue. Cerner and Endo Pharmaceuticals, leading healthcare software and pain medication providers, serve as proof that companies can grow through this most recent recession, as do Green Mountain Coffee, Middleby, Deckers Outdoors, and Intuitive Surgical. Even during recessions or slow-growth economic cycles, there are still growth market segments.
There is good news—a select set of exceptional revenue growth companies is leading the way.
I searched for public growth companies between $50 million (small business) in revenue to $10 billion (typically a member of the Standard & Poor’s 500 Index) to identify more than 400 growth companies that are achieving an annual average revenue growth rate in excess of 20 percent.
In particular, what about the small to midsize growth companies below $1 billion in revenue? There is inspiring news about the future of America’s next-generation growth companies. Leading the next generation is a resilient set of 170 companies that are growing beyond $50 million and are likely to achieve $1 billion in revenue over the next five years. Their annual revenue growth is averaging 49 percent, with 99 percent of them achieving record revenue highs.
You may know some of these up-and-coming billion-dollar companies: They include Morningstar, a leading source for financial services and evaluation of mutual funds; and Under Armour, a leading sportswear provider. The companies with the highest revenue-growth rates and strongest fundamental performance can be found in these top industries:
• Oil and gas exploration, production, and services
• Healthcare equipment and services
• Internet software and services
• Biotechnology
Like Under Armour, companies offering distinctive consumer products continue to grow even in the face of consumer spending reluctance.
When it comes to growth during challenging times, however, there can be good news even for the larger companies. The billion-dollar-revenue club continues to defy the norm. Almost three-quarters of these companies, including Paychex, Polycom, and NII Holdings (Nextel International), continue to achieve record revenues. The remaining 25 percent represent a minority that are off their highs. KB Home, Jones Apparel Group, and Avis Budget Group, for example, are suffering from the forces of reduced consumer spending and corporate travel restrictions.
Despite the setbacks of some of these companies, I believe these growth companies, going strong into the next decade, are more than the “green shoots” (to borrow a now-popular term from our President) that will power America’s next employment and economic growth cycle; they are a “green forest.” These are the companies to be involved with—to partner with, buy from, work for, invest in, or simply emulate to achieve exceptional growth through the challenging times ahead.
Secrets of America’s Highest-Growth Companies
What does it take to grow from a million-dollar company to become an exceptional-growth company? I define exceptional-growth companies as having the potential to grow all the way to hundreds of millions or even a billion dollars in revenue. This may seem like a simple question to answer during the up-market periods in the late 1990s or 2003 to 2007: Almost all companies grew, propelled by the rising tide of a growth economy. The real insights can be found by searching for the growth success pattern through the lens of recessionary cycles of 1993 and 1994, 2001 to 2003, and 2007 to 2009. In trying to ferret out insights by posing growth-related questions to leading business executives, investors, and business growth consultants, I realized that the answer would not come from studying organization or leadership theory (though such study can be valuable), or from examining divisions or operating units in larger companies. The answer would come from a quantitative and fact-based analysis of America’s fastest-growing public companies, especially through down market cycles.
Furthermore, the analysis had to hinge on what is often overlooked: revenue performance.Every company can invest, even overinvest, to grow. But not every company can create revenue growth through down market cycles.
My research project began during the last recession (2001- 2003) by searching for the American companies that grew to $1 billion in revenue after their initial public offering (IPO) since 1980. I especially wanted to know if growth was sustainable through down economic cycles.When I synthesized my findings at year-end 2004, I was surprised to find that only 5 percent of these companies grew from a million to more than a billion in revenue and yet they disproportionately accounted for 56 percent of employment and 64 percent of the market value created by all IPO companies! I called this elite set the Blueprint Companies,as they could frame the success pattern, or blueprint, to achieving exceptional growth across up and down economic cycles.
It became increasingly clear that understanding the secrets of their unique financial characteristics as well as managerial traits could frame a blueprint for growth applicable to all economic cycles.
As I have since learned, growing through down market cycles and leading the next growth cycle is the period when companies change market positions and outmaneuver competitors. This is the defining moment that separates companies that merely survive from those that thrive in the next growth cycle.
You will find the fingerprints of these original Blueprint Companies everywhere. Their products enhance our everyday lives and you know many if not most of them. Perhaps just today you used Microsoft software; used the Internet (which rides on Cisco and Juniper Networks networking equipment); shopped on eBay or Amazon.com; purchased a home sound system or office supplies from Best Buy or Staples; visited Home Depot this weekend to buy materials to fix your home or improve your garden. Perhaps recently you watched movies from Time Warner; took medicine from Amgen, Genentech, or MedImmune; or used financial services from Charles Schwab. Do you depend on Express Scripts, UnitedHealth Group, or HCA Inc. for your prescriptions and health plan?
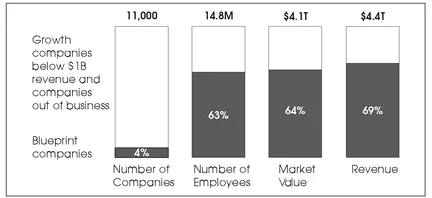
When I was actively engaged in my research in 2001, little did I know that history would repeat itself in late 2007 through mid-2009 and we would experience another recessionary cycle closer to a modern-day version of the Great Depression. The severity of this recession will mean a “new normal” for the next growth cycle, which will be characterized by customers with limited capital to spend, emerging global competitors, and rising costs. That said, I continue to be amazed at the disproportionately positive impact a small number of companies had and continue to have on America’s growth, employment, and investors. As of year-end 2009, this disproportionate ratio remains intact. While the number of public companies has grown to 11,000 from 7,500 in 2004, only 410 companies from this set, or 4 percent, account for more than 9 million employees, $2.6 trillion of market value, and $3 trillion in revenues. For the government, these 410 companies account for 72 percent of the taxes of all IPO companies since 1980. Growth companies are good business even for governments! (See Figure 1.1.)
FIGURE 1.1
Blueprint Companies Are America’s Growth Engine
Source:Standard & Poor’s Compustat, Blueprint analysis.
As of January 2010, Blueprint Companies represent 4 percent of American companies that went public since 1980 and achieved $1 billion in revenue. Yet they disproportionately account for 63 percent of the employment created, 64 percent of the market value, and 69 percent of the revenue of all new public companies!2
New Blueprint Companies continue to affect our liv...