![]()
1
Introduction
I cannot help feeling that seismology will stay in the place at the center of solid earth science for many, many years to come.
The joy of being a seismologist comes to you, when you find something new about the earth’s interior from the observation of seismic waves obtained on the surface, and realize that you did it without penetrating the earth or touching or examining it directly.
Keiiti Aki, presidential address to the Seismological Society of America, 1980
1.1 Introduction
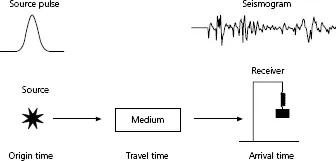
This book is an introduction to seismology, the study of elastic waves or sound waves in the solid earth. Conceptually, the subject is simple. Seismic waves are generated at a source, which can be natural, such as an earthquake, or artificial, such as an explosion. The resulting waves propagate through the medium, some portion of the earth, and are recorded at a receiver (Fig. 1.1-1). A seismogram, the record of the motion of the ground at a receiver called a seismometer, thus contains information about both the source and the medium. This information can take several forms. The waves provide information on the location and nature of the source that generated them. If the origin time when the waves left the source is known, their arrival time at the receiver gives the travel time required to pass through the medium, and hence information about the speed at which they traveled, and thus the physical properties of the medium. In addition, because the amplitude and shape of the wave pulses that left the source are affected by propagation through the medium, the signals observed on seismograms provide additional information about the medium.
1.1.1 Overview
Before embarking on our studies, it is worth briefly outlining some of the ways in which seismology is used to study the earth, and some of the methods used. Seismology is the primary tool for the study of the earth’s interior because little of the planet is accessible to direct observation. The surface can be mapped and explored, and drilling has penetrated to depths of up to 13 kilometers, though at great expense. Information about deeper depths, down to the center of the earth (approximately 6371 km), is obtained primarily from indirect methods. Seismology, the most powerful such method, is used to map the earth’s interior and study the distribution of physical properties. The existence of the earth’s shallow crust, deeper mantle, liquid outer core, and solid inner core are inferred from variations in seismic velocity with depth. Our ideas about their chemical compositions, including the presumed locations of changes in mineral structure due to the increase of pressure with depth, are also based on seismological data. Near the surface, seismology provides detailed crustal images that reveal information about the locations of economic resources like oil and minerals. Deeper in the earth, seismology provides the basic data for understanding earth’s dynamic history and evolution, including the process of mantle convection.
Seismology is also the primary method for studies of earthquakes. Most of the information about the nature of faulting during an earthquake is determined from the resulting seismograms. These observations are useful for several purposes. Because earthquakes generally result from the motions of the plates making up the earth’s lithosphere, which are the surface expression of convection within earth’s mantle, knowledge of the direction and amount of motion is valuable for describing plate motions and the forces giving rise to them. Analysis of seismograms also makes it possible to investigate the physical processes that occur prior to, during, and after faulting. Such studies are helpful in assessing the societal hazards posed by earthquakes.
Our purpose here is to discuss some basic ideas about seismology and its applications. To do this, we first introduce several concepts about waves in a solid medium. We will see that a few simple but powerful ideas give a great deal of insight into how waves propagate and respond to variations in physical properties in the earth. Fortunately, most of these ideas are analogous to familiar concepts in the propagation of light and sound waves. As a result, studying the earth with seismic waves is conceptually similar to sensing the world around us using light and sound. For example, you are reading this by receiving light reflected off the paper. We see color because light has different wavelengths; the sky is blue because certain wavelengths are scattered preferentially. An even closer analogy is the use of sound waves by bats, dolphins, and submarines to “see” their surroundings. Seismology gives detailed images of earth structure, much as sound waves (ultrasound) and electromagnetic waves (X-rays) are used in medicine to study human bodies.
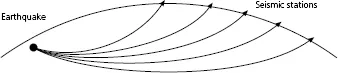
A familiar property of light is that it bends when traveling between materials in which its speed differs. Objects inserted into water appear crooked, because light waves travel more slowly in water than in air. Prisms and lenses use this effect, called refraction. This phenomenon occurs in the earth because seismic wave velocities generally increase with depth. Wave paths bend away from the vertical as they go deeper into the earth, eventually become horizontal (“bottom”), turn upward, and return to the surface (Fig. 1.1-2). The wave paths are thus used to infer the variation of seismic velocity, and hence the composition and physical properties of material, with depth in the earth.
Fig. 1.1-2 Seismic ray paths in the earth, showing the effect of an increase in seismic velocity with increasing depth. The waves travel in curved paths between the earthquake and seismic stations.
Just as light waves reflect at a mirror, seismic waves reflect at interfaces across which physical properties change, such as the boundary between the earth’s mantle and core. Because the amplitudes of the reflected and transmitted seismic waves depend on the velocities and densities of the material on either side of the boundary, analysis of seismic waves yields information on the nature of the interface. In addition to refraction and reflection, waves also undergo diffraction. Just as sound diffracts around the corner of a building, allowing us to hear what we cannot see, seismic waves bend around “obstacles” such as the earth’s core.
The basic data for these studies are seismograms, records of the motion of the ground resulting from the arrival of refracted, reflected, and diffracted seismic waves. Seismograms incorporate precise timing, so that travel times can be determined. The seismometer’s response is known, so the seismogram can be related to the actual ground motion. Because ground motion is a vector, three different components (north–south, east–west, and up–down) are typically recorded. Hence, although seismograms at first appear to be simply wiggly lines, they contain interesting and useful information.
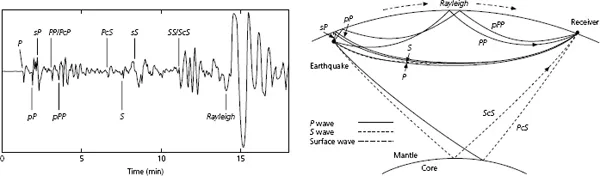
To illustrate the use of seismology for the study of earth structure, consider a seismogram from a magnitude 6 earthquake in Colombia, recorded about 4900 kilometers away in Colorado (Fig. 1.1-3). Several seismic wave arrivals, called phases, are identified using a simple nomenclature that describes the path each followed from the source to the receiver. We will see that seismic waves are divided into two types. In one type, P or compressional waves, material moves back and forth in the direction in which the wave propagates. In the other, S or shear waves, material moves at right angles to the propagation direction. P waves travel faster than S waves, so the first arriving pulse, labeled “P,” is a P wave that followed a direct path from the earthquake to the seismometer.1 Soon afterwards, a pulse labeled pP appears, which went upward from the earthquake, reflected off the earth’s surface, and then traveled to the seismometer as a P wave. If the distribution of seismic velocity near the source is known, the depth of the earthquake below the earth’s surface can be found from the time difference between the direct P and pP phases, because the primary differences between their ray paths are the pP segments that first go up to and then reflect off the surface. The phase marked PP is a compressional wave that went downward from the source, “bottomed,” reflected at the surface, and repeated the process. Among the later arrivals on the seismogram are shear wave phases, including the direct shear wave arrival, S, and a shear phase SS that reflected off the surface, analogous to PP. All these phases, which traveled through the earth’s interior, are known as body waves. The large amplitude wave train that arrives later, marked “Rayleigh,” is an example of a different type of wave. Such surface waves propagate along paths close to the earth’s surface.
Fig. 1.1-3 Left: Long-period vertical component seismogram at Golden, Colorado, from an earthquake in Colombia (July 29, 1967), showing various seismic phases. The distance from earthquake to station is 44°. Right: Ray paths for the seismic phases labeled on the seismogram.
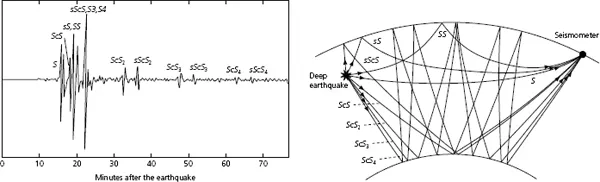
Fig. 1.1-4 Seismogram (left) and ray paths (right) for a deep focus earthquake in Tonga, recorded at Oahu (Hawaii), showing multiple core reflections.
Figure 1.1-4 shows a seismogram from an earthquake at a depth of 650 km in the Tonga subduction zone recorded in Hawaii. The seismometer is oriented such that all the arrivals are shear waves. In addition to S and SS, phases reflected at the core–mantle boundary appear. ScS went down from the source, reflected at the core–mantle boundary (hence “c”), and came back up to the seismometer. Its travel time gives the depth to the core if the velocity in the mantle is known. Alternatively, if the depth to the core is known, the travel time gives a vertical average of velocity with depth in the mantle. In addition, the large amplitude of these reflections constrains the contrast in physical properties between the solid rock-like lower mantle and the fluid iron outer core. Multiple reflections also occur: ScSScS, or ScS2, reflects twice at the core–mantle boundary, ScS3 reflects three times, and ScS4 four times. Similar to the phase SS, the S3 wave reflects twice off the surface, and S4 reflects three times. By analogy to pP, sScS went upward from the source and was reflected first at the surface and then at the core–mantle boundary. Most of the multiple SS and ScS phases also have observable surface reflected phases (e.g., sScS2, sScS3, etc.).
These examples indicate some of the ways in which seismological observations are used to study earth structure. By collecting many such records, seismologists have compiled travel time and amplitude data for many seismic phases. Because the different phases have different paths, they provide multiple types of information about the distribution of seismic velocities, and therefore physical properties within the earth. Seismology can also be used to study the internal structure of other planets; seismometers were deployed on the lunar surface by each of the Apollo missions, and the Viking spacecraft that landed on Mars carried a seismometer.
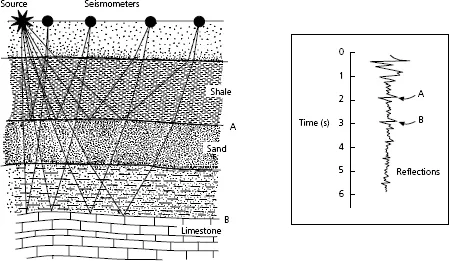
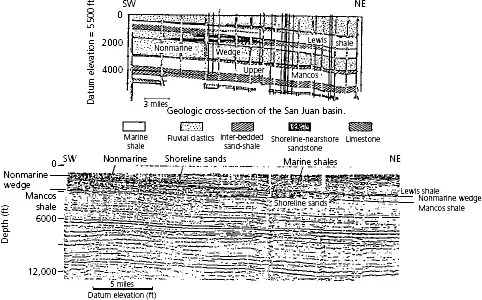
An important use of seismology is the exploration of near-surface regions for scientific purposes or resource extraction. Figure 1.1-5 shows a schematic version of a common technique used. An artificial source at or near the surface generates seismic waves that travel downward, reflect off interfaces at depth, and are detected by seismometer arrays. The resulting data are processed using computers to enhance the arrivals corresponding to reflections and to estimate the velocity structure. Seismograms from different receivers are then displayed side by side, with the travel time increasing downward, to yield an image of the vertical structure. Reflections that match between seismograms give near-horizontal arrivals that often correspond to interfaces at depth. The vertical axis can be converted from time to depth using the estimated velocities, and reflectors can be identified using geological information from the surface and drill holes (Fig. 1.1-6). Such seismic images of the subsurface provide a powerful tool for structural and stratigraphic studies. Although applications of seismology to exploration have traditionally been treated in universities as distinct from those dealing with earthquakes and the large-scale structure of the earth, this distinction is largely historical.2 These applications draw on a common body of seismological principles, and the techniques used have considerable overlap.
Fig. 1.1-5 Schematic example of the seismic reflection method, the basic tool of hydrocarbon exploration.
Fig. 1.1-6 Data from a reflection seismic survey across the San Juan Basin, New Mexico (bottom) and the resulting geological interpretation (top). [Sangree and Widmier, 1979. Reprinted by permission of the Society of Exploration Geophysicists.)
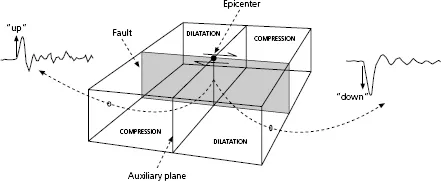
Seismic sources — typically earthquakes — are also a major topic of seismological study. The location of an earthquake, known as the focus or hypocenter, is found from the arrival times of seismic waves recorded on seismometers at different sites. This location is often shown by the epicenter, the point on the earth’s surface above the earthquake. The size of earthquakes is measured from the amplitude of the motion recorded on seismograms, and given in terms of magnitude or moment.3 In addition, the geometry of the fault on which an earthquake occurred is inferred from the three-dimensional pattern of radiated seismic waves. Figure 1.1-7 illustrates the method used for an earthquake in which the material on one side of a vertically dipping fault moves horizontally with respect to that on the other side. This motion generates seismic waves that propagate away in all directions. In some directions the ground first moves away from the source (toward a seismic station), whereas in other directions the ground first moves toward the source (away from a receiver). The seismograms thus differ between stations. In the “toward” (called compressional) quadrants the first ground motion recorded is toward the receiver, whereas in the “away” (called dilatational) quadrants the first ground motion is away from the receiver. Because the seismic waves go down from the source, turn, and arrive at a distant seismographic station from below, the first motion is upward in a compressional quadrant and downward in a dilatational quadrant.4 The compressional and dilatational quadrants can be identified using seismograms recorded at different azimuths around the source. The fault orientation and a surface perpendicular to it can then be found, because in these directions the first motion changes polarity. With the use of additional data we can often tell which of these surfaces was the actual fault. Given the fault orientation, the direction of motion can also be found; note that the compressional and dilatational quadrants would be interchanged if the fault had moved in the opposite direction. The pulse radiated from the earthquake also gives some information about the amount of slip that occurred, the size of the area that slipped, and the slip process.
Fig. 1.1-7 First motions of seismic P waves observed at seismometers located in various directions about the earthquake allow the fault orientation to be determined.
Such observations of the location of earthquakes and the fault motion that occurred in them are among the most important data we have for understanding plate tectonics, the primary process shaping our planet. The earthquake analyzed in Fig. 1.1-7, for example, i...